
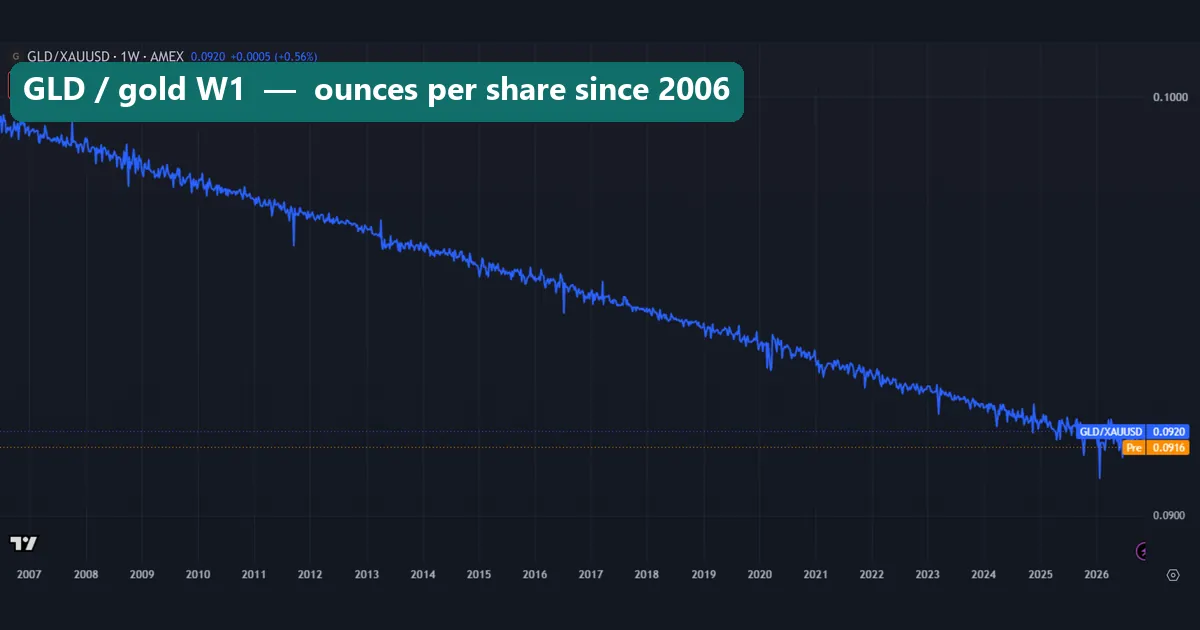
The ETP meaning is short: an exchange-traded product is any investment that lists on a stock exchange and trades in shares all day, like a stock. But the label covers three different things: funds, commodity trusts and notes. This guide settles what each one is and what you own. Then our TradingView numbers show what fees, daily leverage and VIX futures did to six real ETPs. The first chart shows how much gold one GLD share has held since 2006.
ETP meaning: what an exchange-traded product is
ETP stands for exchange-traded product. The SEC’s ETP glossary page on Investor.gov calls them products “listed and traded on national securities exchanges”. So you buy and sell them through a broker, at a price that moves all day. A mutual fund is different: you buy it once a day at its closing value. Off-exchange deals differ too, as our guide on what OTC means explains.
Most ETPs follow something else: an index, a metal, a set of futures, or a multiple of an index’s daily move. Our page on what indices are covers the most common case. In short, “ETP” tells you how a product trades. It does not tell you what it holds or who owes you money.
Fund, commodity trust or note: what you actually own
The same SEC page names three types, and each gives you a different claim.
- Exchange-traded fund (ETF). A fund that registers under the Investment Company Act of 1940, like a mutual fund. It owns the assets, and you own its shares. QQQ, TQQQ and SQQQ are ETFs.
- Exchange-traded commodity trust. A trust that holds a commodity, such as gold bars, or commodity futures. It does not register as an investment company, even when people call it an ETF. GLD and SLV are trusts of this kind.
- Exchange-traded note (ETN). An unsecured debt of a bank that pays a return linked to an index. It owns nothing for you, so if the bank fails, you stand in line as a lender. VXX is an ETN.
The SEC adds that ETNs “can result in the loss of the entire investment”. Outside the US you will also meet ETC, short for exchange-traded commodity: read the prospectus to see whether it holds metal or is a note. Oil works the same way. Our guide on how to invest in oil covers USO, an ETP that holds oil futures rather than barrels.
How an ETP follows its market
An ETP’s price stays near the value of its holdings because large dealers can swap blocks of shares for the assets, or the reverse. When the price drifts above the assets, they create shares and sell them. When it drifts below, they buy shares and hand them back. That keeps the gap small on most days, but not on all of them.
Two pieces of math then decide most of what you see on a chart. The first is the fee. A metal trust sells a little metal to pay its costs, so the metal behind each share shrinks:
ounces per share now = ounces at start x (1 - yearly fee) ^ yearsThe second is the daily reset. The ProShares TQQQ fund page sets its goal at three times “the daily performance of the Nasdaq-100 Index”. Then it starts again the next day, so the multiple compounds:
fund over n days      = (1 + 3 x r1) x (1 + 3 x r2) x ... x (1 + 3 x rn) - 1
three times the index = 3 x [ (1 + r1) x (1 + r2) x ... x (1 + rn) - 1 ]
Those two lines are not equal. The same page says higher index volatility leads to returns worse than the daily target. Our guide to compounding in forex walks through the same math on an account.
How we tested six ETPs
We pulled daily bars from the TradingView web chart on 16 November 2026. Bars dated 16 November were still forming, so we dropped them, and every window ends on Friday 13 November 2026.
- AMEX:GLD against OANDA:XAUUSD (spot gold), 20 March 2006 to 13 November 2026, 5,198 days
- AMEX:SLV against OANDA:XAGUSD (spot silver), 28 April 2006 to 13 November 2026, 5,170 days
- NASDAQ:QQQ, NASDAQ:TQQQ and NASDAQ:SQQQ, 11 February 2010 to 13 November 2026, 4,216 days
- CBOE:VXX, with the VIX index beside it, 30 January 2009 to 13 November 2026
For the metal trusts, we divided the fund’s close by the spot close each day. That gives ounces per share, give or take the gap between price and holdings. For the Nasdaq funds, we set each day’s move against three times QQQ’s move, then compared calendar years. The charts use weekly bars for the long views and daily bars for 2022.
TradingView closes are split-adjusted but not dividend-adjusted, so QQQ’s total return runs a little above our figures. Also, we measured prices only, with no costs or taxes. Our editorial testing policy lists the rules behind every test on this site.
The parameters that define an ETP
The same short list of settings describes any ETP. Check them on the issuer’s page first.
| Parameter | What it tells you | Our six products |
|---|---|---|
| Wrapper | Fund, commodity trust or note | QQQ, TQQQ, SQQQ: funds. GLD, SLV: trusts. VXX: a note |
| Underlying | The price it follows | Nasdaq-100; gold; silver; short-term VIX futures |
| Multiple | How many times the move it targets | 1x for QQQ, GLD, SLV; 3x for TQQQ; -3x for SQQQ |
| Reset period | How often the multiple starts again | Every trading day for TQQQ and SQQQ |
| Yearly fee | The cost taken out of the assets | 0.40% for GLD, 0.50% for SLV (issuer pages, linked below) |
| Who owes you | Whose failure could hurt you | GLD, SLV: custodian banks hold the metal. VXX: the issuing bank |
For traders, the reset row matters most. A product with a daily reset aims at one day. Hold it longer and you own a path, not a multiple.
Reading a metal ETP chart
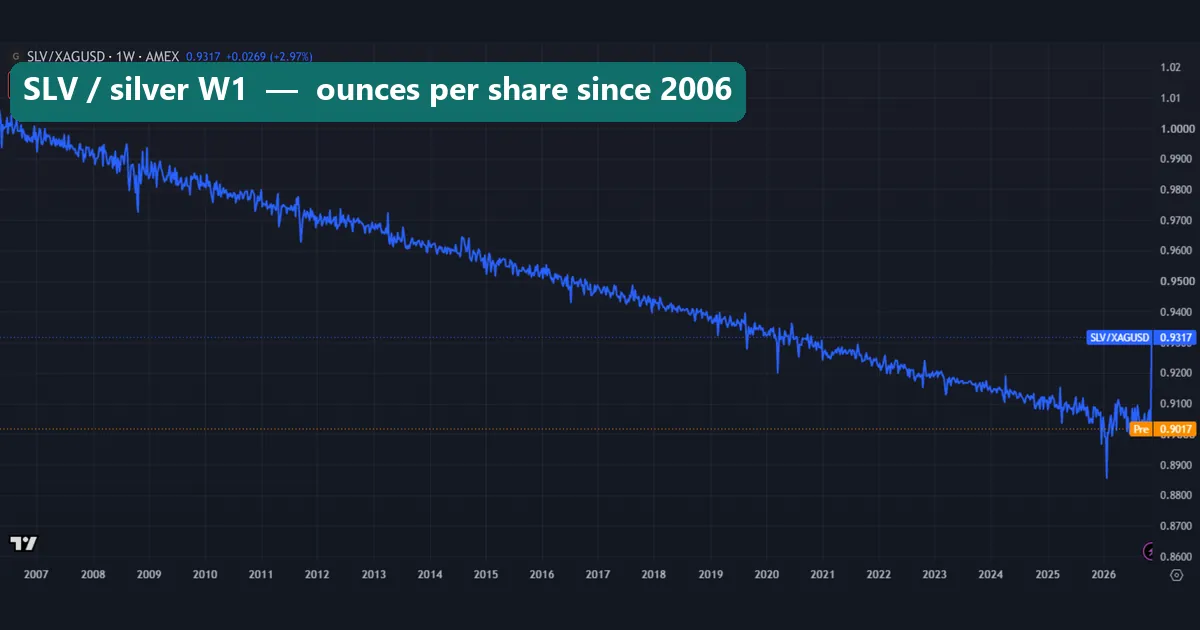
The first chart and this one plot a ratio, not a price: fund close divided by spot close. If the trust held a fixed amount of metal, the line would run flat. Instead, both slope down at an even pace for 20 years. That slope is the fee, and the trust pays it in metal.
The spikes mark days when the two closes did not line up, because the fund stops trading at the stock market close while spot silver trades on. Our XAGUSD guide covers spot silver itself. The last weekly bar jumps to 0.9317, but it was still forming when we pulled the data, so we use the 13 November close.
Reading a leveraged ETP chart
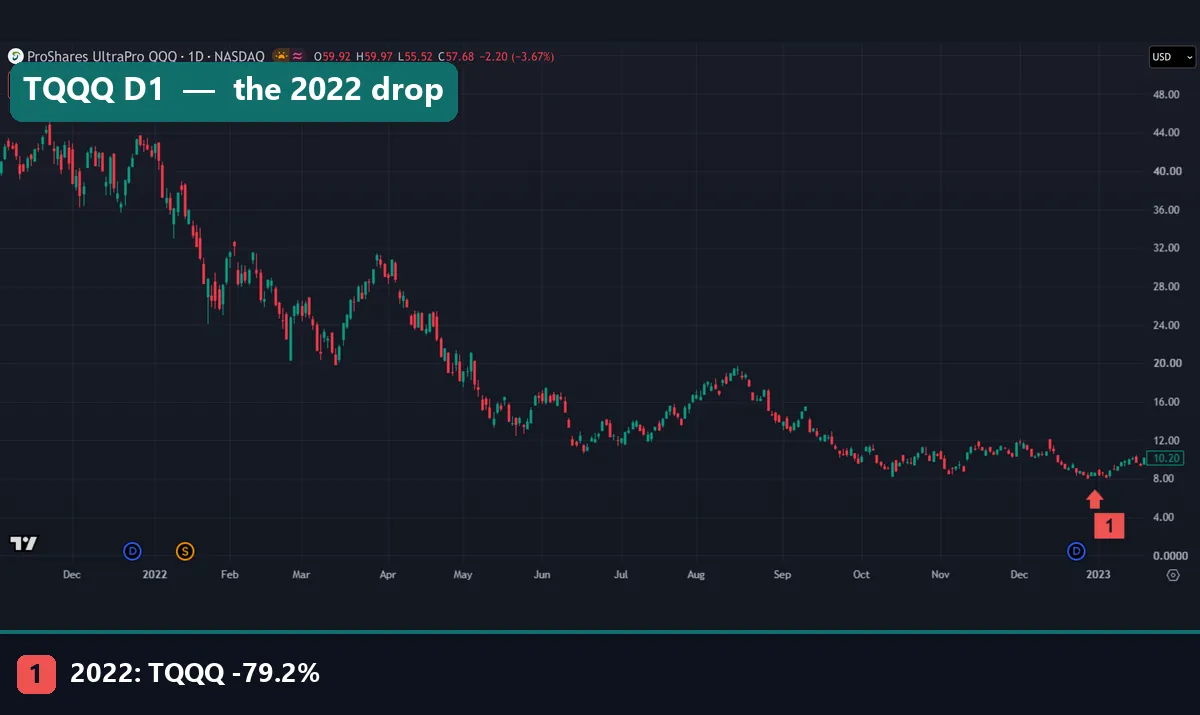
This is TQQQ, the 3x daily Nasdaq-100 fund, from November 2021 to January 2023. Marker 1 sits at the late-December low: TQQQ lost 79.2% in calendar 2022. On the price axis, it traded above 40 in late 2021 and under 10 by the marker. Prices are split-adjusted, and the top legend shows the 13 November 2026 bar, so ignore it here.
Note two things. First, the swings look huge for an index product, because each daily move is tripled. Second, rallies do not repair the damage: the March and the June-to-August rallies both faded, and each later low sat under the one before. The Nasdaq-100 includes the FAANG stocks, and its futures trade almost around the clock, as our Nasdaq 100 futures chart guide shows.
Worked example: the fee inside a gold share
Take GLD across our window: 20.67 years. One share started with a claim on 0.09941 ounces of gold. The SPDR Gold Shares GLD page lists an expense ratio of 0.40%. Put those into the fee formula:
0.09941 x (1 - 0.0040) ^ 20.67 = 0.0915 ouncesOur ratio ended at 0.0915 ounces, so the fee explains the whole drift. That is 0.40% a year, or 7.95% in total. It shows in returns too: spot gold rose 599.9% while GLD’s price rose 544.3%.
Silver tells the same story. The iShares Silver Trust page lists a 0.50% sponsor fee. Our ratio fell 0.515% a year, from 1.00634 to 0.90479 ounces. Over the same window, SLV rose 219.5% and spot silver rose 255.4%.
That is the price of letting a trust store the metal for you. For a short trade the fee barely registers, but over two decades it took nearly 8% of the gold behind each share.
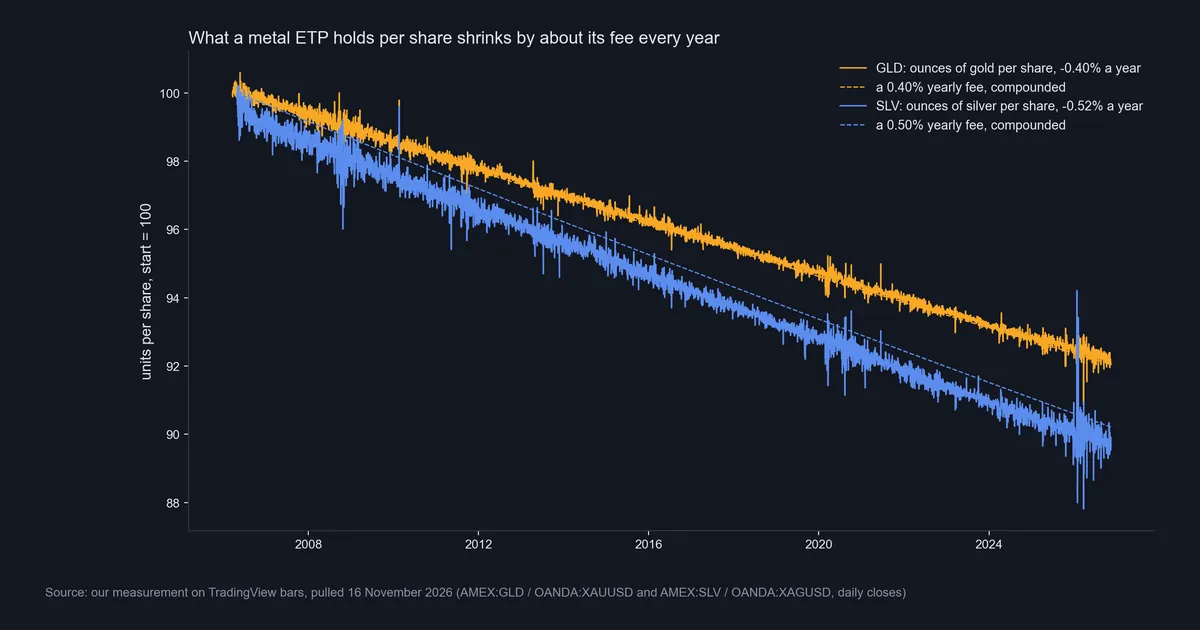
The data chart puts both ratios on one scale, with the start set to 100. Each dashed line is the fee alone, compounded. GLD hugs its 0.40% line. SLV runs a little under its 0.50% line and gets noisier at the right edge.
Worked example: a 3x fund in 2022 and 2025
Now take the Nasdaq trio. In 2022, QQQ fell 33.07%. Three times that is -99.21%, which would have left almost nothing. TQQQ fell 79.2%: a heavy loss, yet far less than three times the year. SQQQ, the -3x fund, gained 81.85% where that logic says 99.21%.
Then 2025 ran the other way. QQQ rose 20.16%, so three times the year was 60.48%. But TQQQ rose only 33.25%, and SQQQ lost 56.01%.
| Calendar year | QQQ | 3 x QQQ | TQQQ | SQQQ |
|---|---|---|---|---|
| 2018 | -0.96% | -2.88% | -19.90% | -22.08% |
| 2020 | +47.57% | +142.71% | +110.05% | -86.44% |
| 2022 | -33.07% | -99.21% | -79.20% | +81.85% |
| 2023 | +53.79% | +161.37% | +193.06% | -75.10% |
| 2025 | +20.16% | +60.48% | +33.25% | -56.01% |
| 2026 to 13 November | +10.68% | +32.04% | +9.41% | -38.01% |
In 2018, QQQ barely moved, yet TQQQ and SQQQ both lost about a fifth: the cost of a choppy year with a daily reset. In 2023, a strong and steady climb, TQQQ beat three times the year. Across the 17 calendar periods in our window, TQQQ beat three times QQQ in nine and fell short in eight. So you cannot know in advance which way it will miss.
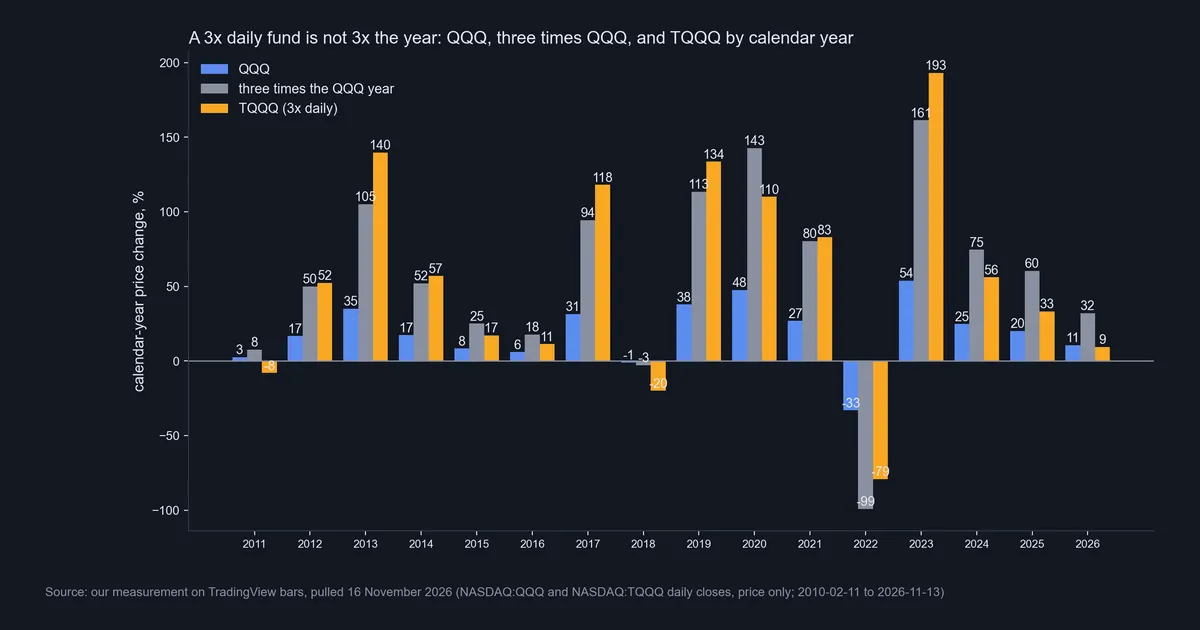
The bar chart shows each year from 2011, since 2010 is a part year. Grey bars are three times the QQQ year, and orange bars are TQQQ. The gaps run both ways.
Download the complete indicator database
Put these concepts on your charts. One email unlocks the full library of 1,380+ indicators with compiled MT4 and MT5 files, plus my TradingView scripts. No paywall, no spam, unsubscribe any time.
Get free access to my indicator database
One email unlocks 1,380+ free MT4, MT5 and TradingView indicators — the complete library. No single-tool download; you get the whole database.
Where it fails: daily products held for a year
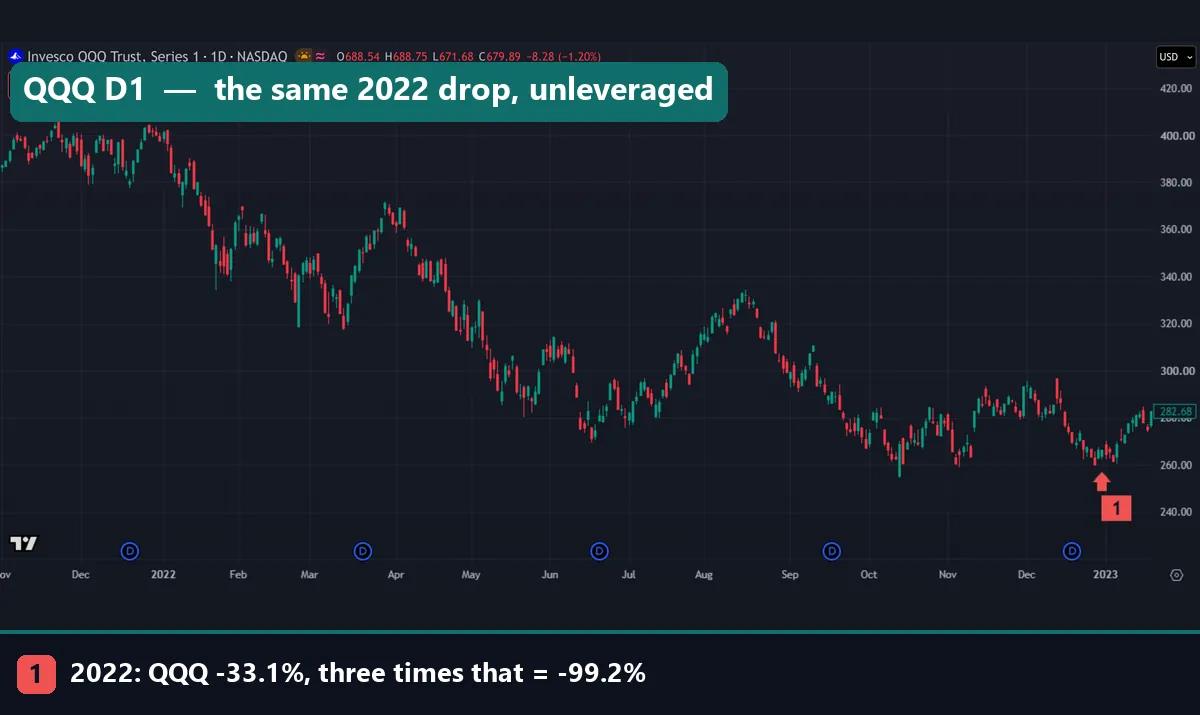
This is QQQ over the same window as the TQQQ chart. QQQ fell 33.1% in 2022, and three times that is 99.2%. The plain fund dropped from about 400 to about 260 on the price axis. It hurt, but it left a base to recover from. The 3x fund lost 79.2% and needed a far larger gain to get back to even.
That is where leveraged and inverse ETPs fail: as long-term holdings. Over our window, TQQQ multiplied 266.7 times while QQQ multiplied 15.57 times, because the trend was steady and up. But SQQQ, the mirror image, lost more than 99.999%. Nobody knows in advance which of the two a market will hand you. Our guides to leverage risk and what CFDs are cover the same trap in other wrappers.
Our numbers fail in places too. A chart close is a trade price, not the official net asset value. GLD’s page says it sets NAV between 10:30 a.m. and 12:00 p.m. New York time. So a ratio of closes carries noise. SLV’s ratio even ended 2026 above its 2025 year-end level, 0.90479 against 0.89916, which a fee cannot do. Daily tracking, by contrast, was tight: a median gap of 6.7 basis points for TQQQ and 7.7 for SQQQ. The yearly misses come from compounding, not from poor tracking.
Where it fails worst: VIX futures notes
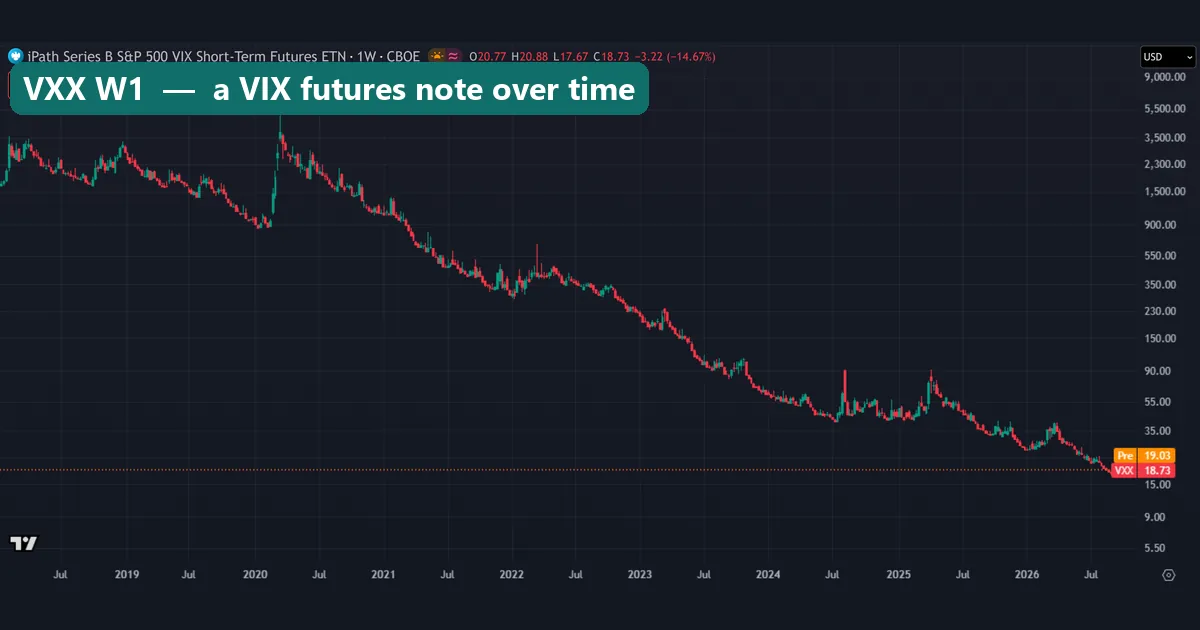
VXX is an ETN that follows the S&P 500 VIX Short-Term Futures index, as its full name on the chart says. This weekly chart runs on a log scale from early 2018. The early-2020 spike climbed above the 3,500 line, yet VXX ended 2020 only 11.0% above its 2019 close.
From 30 January 2009 to 13 November 2026, VXX lost more than 99.999%. TradingView adjusts for its reverse splits, so the first close shows as 6,853,754.88 and the last as 18.73. Meanwhile the VIX itself only fell from 44.84 to 19.3. VXX rose on 40.8% of days, yet since 2010 only 2018 (+67.9%) and 2020 (+11.0%) closed the year higher.
The cause is the roll. Later VIX futures usually cost more than the front month, so a product that keeps moving into later months pays up each time. On TradingView’s continuous VX1! and VX2!, the second month sat above the front on 83.2% of days from 2004 to 2026. Our futures contract vs forward guide explains how futures expire. Also, the current note, Series B, began in January 2018, so the earlier history comes from the first VXX note.
Four common mistakes with ETPs
- Treating every ETP as a fund. An ETN is a bank’s promise, and a commodity trust is not a registered investment company. Check the wrapper first.
- Expecting 3x the year from a daily 3x fund. In 2025, QQQ rose 20.16% and TQQQ rose 33.25%, not 60.48%.
- Using VXX as a long-term hedge. It rose on 40.8% of days and still lost more than 99.999% over our window.
- Ignoring a small fee. GLD’s 0.40% a year took 7.95% of the gold behind each share over 20.67 years.
Where to go next
For a plain buy-and-hold position, our guide to going long measures how often a long ended higher. For volatility, read our TradingView VIX chart guide and our page on the VIX in forex. QQQ’s 2022 fall went past a plain correction, and our market correction guide shows where that line sits. Before you trade any ETP, read its prospectus on the issuer’s page.
FAQ: ETP meaning and common questions
What does ETP stand for?
ETP stands for exchange-traded product, an investment that lists on a stock exchange and trades in shares through the day. ETFs, commodity trusts and ETNs all count as ETPs.
Is an ETF the same as an ETP?
Every ETF is an ETP, but not every ETP is an ETF. GLD and SLV are commodity trusts, and VXX is a bank’s note. The names get mixed up in daily use, so check the wrapper on the issuer’s page.
What is the difference between an ETN and an ETF?
An ETF owns assets for its shareholders. An ETN is an unsecured debt of a bank, with a return linked to an index. So with an ETN you carry the bank’s credit risk on top of the market risk.
Do ETPs charge fees?
Most take a yearly fee out of the assets. In our data, GLD’s ounces per share fell 0.40% a year and SLV’s fell 0.515%, close to their published fees of 0.40% and 0.50%.
Can I hold a leveraged ETP for the long term?
You can, but the year will not equal the multiple times the index’s year. In 2022, TQQQ lost 79.2% against three times QQQ’s -99.21%. In 2025, it gained 33.25% against three times QQQ’s 60.48%.
Why did VXX lose so much?
VXX follows short-term VIX futures and keeps rolling into later months that usually cost more. From 2009 to 2026 it lost more than 99.999%, while the VIX itself fell from 44.84 to 19.3.
Why does an ETP’s chart price differ from its NAV?
A chart shows the last trade, while the issuer sets net asset value once a day. GLD sets its NAV before midday New York time, hours before the closing trade.
Is an ETP a safe investment?
An ETP is a wrapper, so its risk is the risk of what sits inside, plus the bank’s credit for an ETN. In our data, a -3x fund and a VIX note each lost more than 99.999%. Check the wrapper, fee and reset first: results are not guaranteed; past performance is not indicative of future results.
Last updated: 16 November 2026.

About the author
Written by Dominic Walsh, a Forex trader and MT4/MT5 indicator, Expert Advisor and script developer. Every tool on forexmt4systems.com is tested on live charts before release and ships with ready-to-use compiled MT4 (.ex4) and MT5 (.ex5) files. Learn more about the trader and developer behind this site.
How we build, test and correct every tool: Editorial & Testing Policy. Trading carries risk; see the disclaimer.