
A Fibonacci time zone is a set of vertical lines that runs forward from one swing on a chart, spaced at Fibonacci multiples of a chosen gap. The claim behind it is simple: turning points tend to land on those lines. This guide tests that claim. First, we drew the tool on real TradingView charts. Then we ran the same rule on 126,245 later swing points from eight years of daily FX history. The short answer: swings landed on a Fibonacci line 7.3% of the time and on a randomly placed line 7.4% of the time. So the lines did no better than chance. Below you will see how the tool works, how we tested it, and what it can still do for you.
What a Fibonacci time zone is
The tool is a drawing, not an indicator. You pick two points, A and B. The gap between them in bars becomes the base unit. The tool then drops vertical lines at 1, 2, 3, 5, 8, 13 and 21 times that unit, counted from A. It never plots a price. It only marks dates in the future.
That makes it different from the price tools in the same family. A Fibonacci retracement asks how far a pullback may go. A Fibonacci extension asks how far a move may run. The time zone asks a third question instead: when might something happen?
TradingView lists it as “Fib Time Zone” among its Fibonacci drawings. MetaTrader has the same object too. The MQL5 reference calls it OBJ_FIBOTIMES in the MQL5 documentation, and it works the same way on MT4 and MT5. In both platforms the tool gives no direction. A line can mark a top, a bottom, or nothing at all.
Where the idea comes from
The spacing comes from the Fibonacci sequence: 0, 1, 1, 2, 3, 5, 8, 13, 21, 34 and so on. Each number is the sum of the two before it. The Fibonacci sequence on Wikipedia covers the maths and its long history.
Traders borrowed the ratios for price levels first. The time version uses the raw numbers instead. The same habit of mapping numbers onto time shows up in Elliott wave Fibonacci counts and in Gann’s square of nine.
Most write-ups describe the tool as a way to anticipate reversal points. For example, the Fibonacci Time Zones page at StockCharts ChartSchool frames it that way. But such pages rarely count hits against misses. This article does.
How the lines are spaced
The mechanism fits in one line. Let A be the first anchor bar and d the number of bars from A to B. Then each line sits at:
line(n) = A + F(n) x d, where F(n) is 1, 2, 3, 5, 8, 13, 21, 34 …
So with a gap of 5 bars, the lines fall 5, 10, 15, 25, 40, 65 and 105 bars after A. Line 1 is B itself. Line 0 is A. That is why TradingView labels them 0, 1, 2, 3, 5, 8, 13 and 21 along the bottom of the chart.
Two things follow. First, early lines bunch up while later ones spread far apart. Second, the spacing on our charts follows bars, not calendar days. On EURUSD daily, line 1 sits five bars after A, which is seven calendar days, so weekends add no distance.
In short, the whole forecast rests on where you put A and B. Move either anchor by one bar and every later line shifts, the far ones most.
How we tested Fibonacci time zones
We ran two checks. The first was visual. On 5 October 2026 we drew the tool on a TradingView web chart with OANDA data. Our anchors sat on real swing points: EURUSD, GBPUSD, USDJPY and AUDUSD on the daily chart, plus XAUUSD and GBPJPY on the 1-hour chart.
The second check was a count. We used MetaTrader 4, build 1471, with history from the Capital Point Trading terminal. The sample covered 23 FX pairs on the daily chart, from 12 June 2018 to 24 August 2026, for 37,748 candles.
Next, we marked swing points with an 11-bar swing rule (the extreme of 5 bars on each side), a wider version of Williams fractals. Each pair of back-to-back swings, A and B, set the base gap d. Then we placed lines at A plus 2, 3, 5, 8, 13, 21 and 34 times d. A later swing counted as a hit when it landed within one bar of a line.
Finally, we built a control: the same number of lines at random bars over the same span. If Fibonacci lines carry timing value, they should catch more swings. This is a timing test, not a trade test, so spread, swap and commission play no part. Our full method rules sit on the editorial testing policy page.
Settings and test parameters
The drawing has few inputs, but each one changes the result. Here is what you set on the chart, next to what we fixed in the count.
| Parameter | What it does | On our charts | In our count |
|---|---|---|---|
| Anchor A | Start of the base gap, line 0 | A real swing high or low | An 11-bar swing (5 bars on each side) |
| Anchor B | End of the base gap, line 1 | The next real swing | The next 11-bar swing |
| Base gap d | Bars from A to B | 3 to 7 bars | Whatever the swings gave |
| Levels | Multiples of d that get a line | 0, 1, 2, 3, 5, 8, 13, 21 | 2, 3, 5, 8, 13, 21, 34 |
| Hit tolerance | How close a swing must be | By eye | Within 1 bar of a line |
| Control | What “chance” looks like | None | Same number of random lines |
| Timeframe | Bar size the gap counts in | Daily and 1-hour | Daily |
We left out lines 0 and 1 in the count, because those are A and B themselves. A swing cannot “hit” its own anchor in any useful sense.
Reading the zones on a chart
Here is how the lines read on two real charts. On GBPUSD daily, anchor A sits on the 8 June 2026 swing low at 1.33390. Anchor B is the 15 June swing high at 1.34120, five bars later.
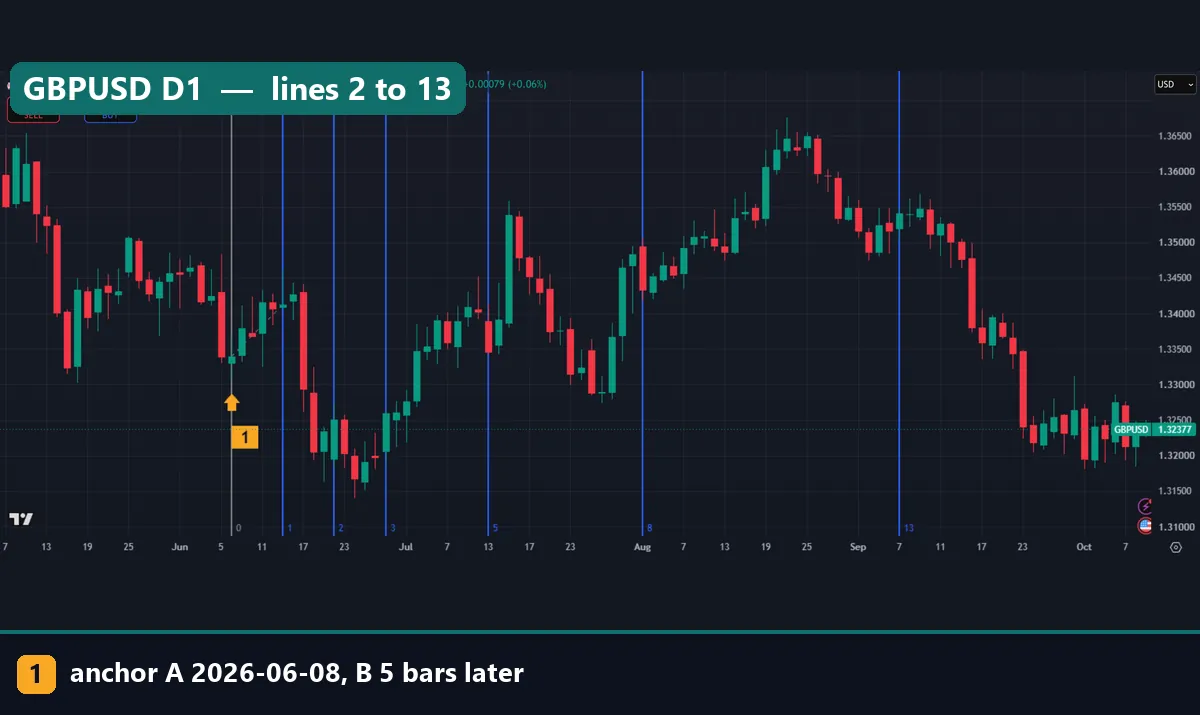
First, the late-June low prints between lines 2 and 3, a few bars from each. Under our one-bar rule, that is a miss. Next, the mid-July high comes shortly after line 5. By eye, many traders would call that a hit, but by our rule it is not. Then the late-August top sits between lines 8 and 13, far from both.
Now the second chart. On gold, 1-hour, anchor A is the 12:00 UTC bar on 1 October 2026 at $4,178.72. B comes three bars later at $4,169.59. So each unit is three hours.
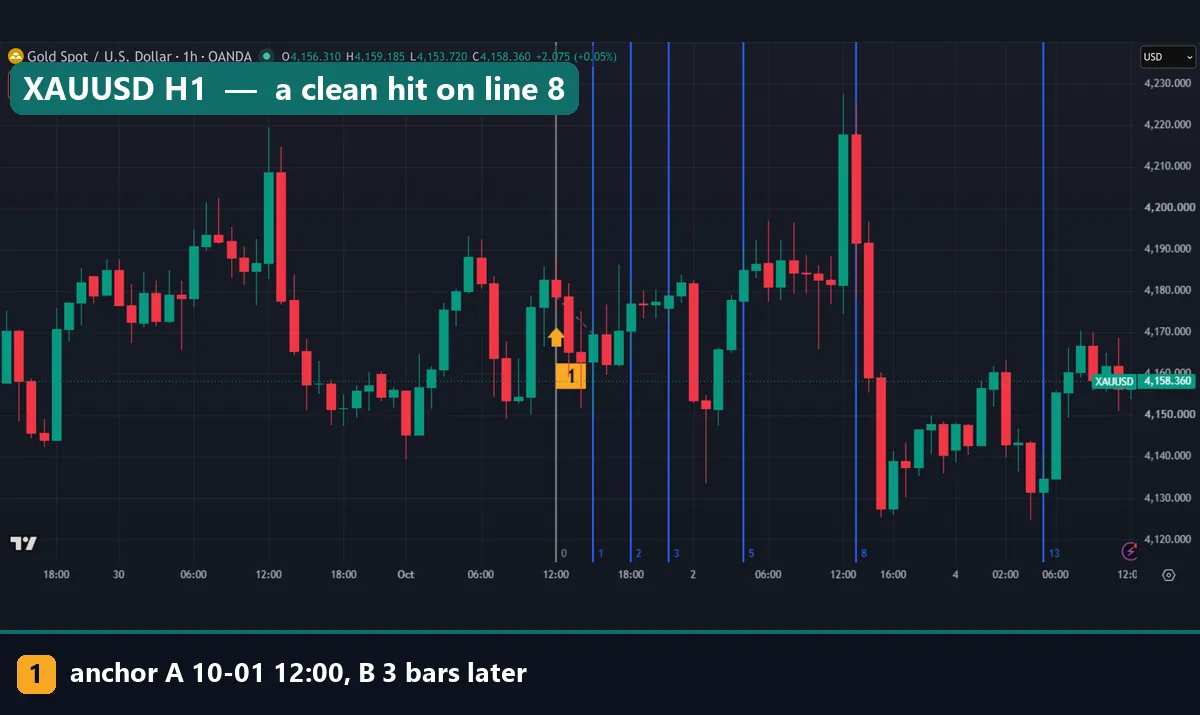
This time line 8 lands right on the tallest candles. Price spikes to near $4,220 on the scale, then falls to near $4,127 within hours. It is a clean hit. But one striking hit says nothing about the quiet misses around it. That is why we counted.
Worked example: EURUSD daily from 8 June 2026
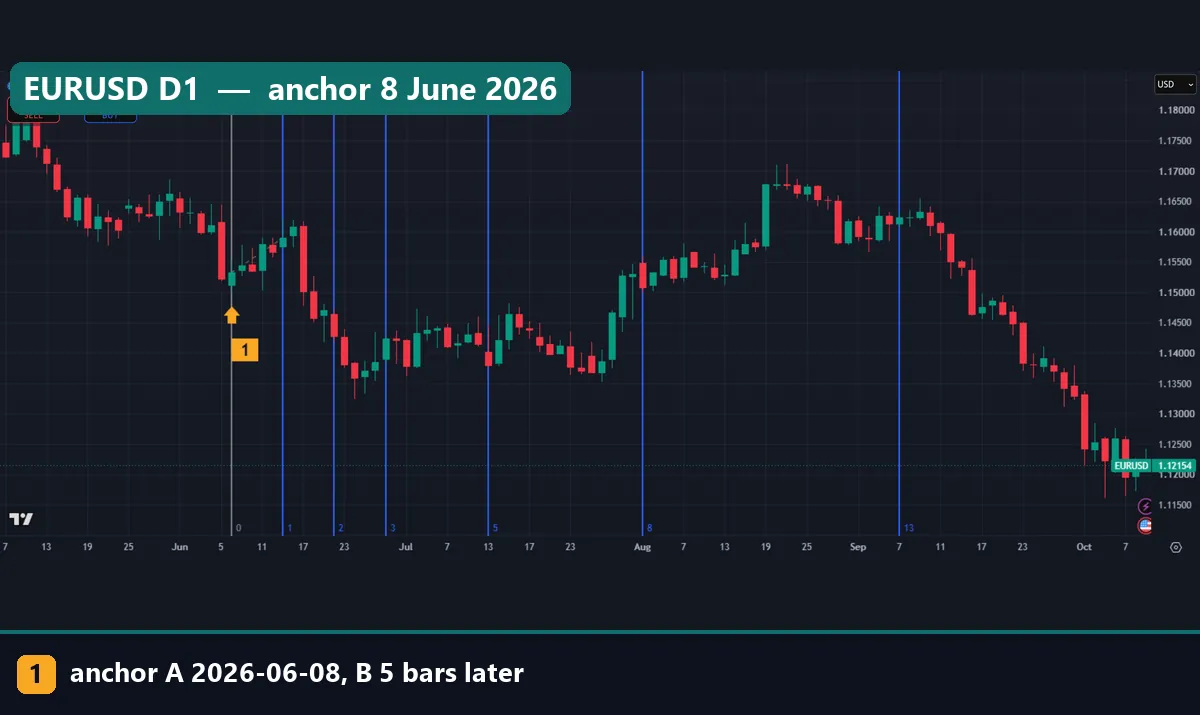
Let us walk through one chart with real numbers. Anchor A is the 8 June 2026 swing low on EURUSD at 1.15324. Anchor B is the 15 June swing high at 1.15894. That is a move of 57 pips over five daily bars, so d = 5.
Next, apply the formula. Line 2 falls 10 bars after A, on 22 June. Line 3 falls 15 bars after A, on 29 June. Line 5 lands 25 bars out, on 13 July. Line 8 lands 40 bars out, on 3 August. Line 13 lands 65 bars out, on 7 September. Each date matches where the blue lines sit in the first image above.
Then compare the lines with the swings. The late-June low falls between lines 2 and 3. Line 5 touches only a minor dip in mid-July. Line 8 lands in the middle of a rally, not at a turn. The August high, near 1.170 on the scale, sits between lines 8 and 13. Line 13 falls in a sideways patch, a little before a slide that carried price to 1.12016 by the time of our capture.
So the lines missed both of the largest turns here. Still, one chart proves little. The count below does the real work.
What 126,245 swings showed
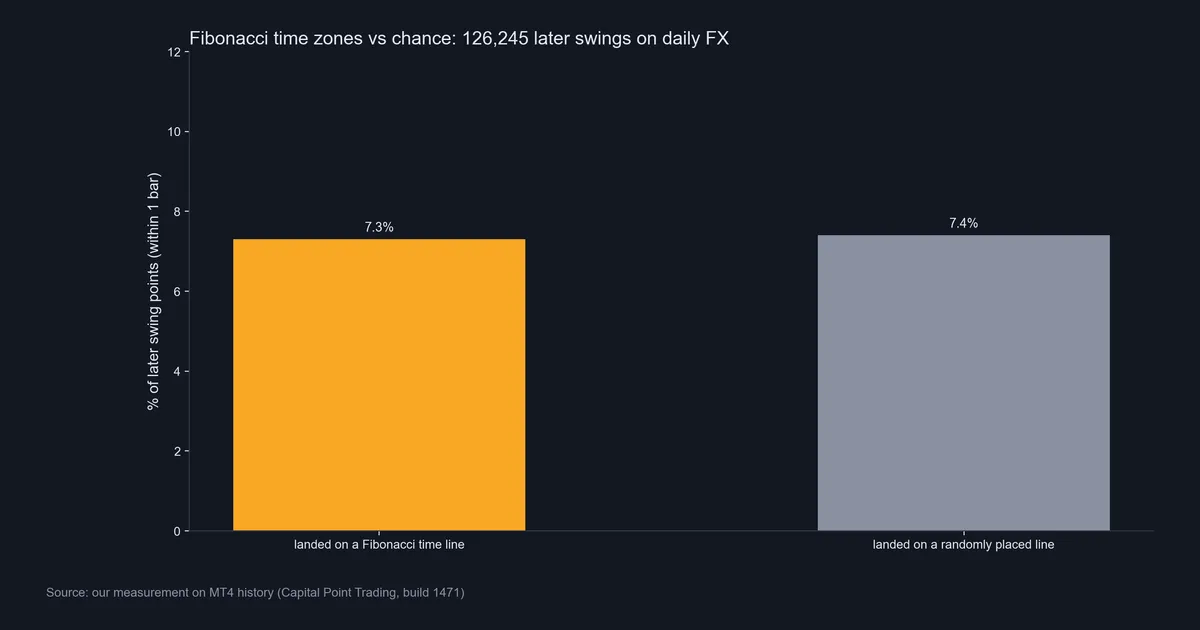
Across 23 pairs and eight years of daily bars, we checked 126,245 later swing points. Of those, 7.3% landed within one bar of a Fibonacci time line. Then we placed the same number of lines at random bars. Those random lines caught 7.4% of swings.
So the Fibonacci spacing did slightly worse than random spacing. A tenth of a point is noise. With a sample this large, a real timing effect would show up as a clear gap. There is none.
That also explains why the tool looks convincing. Seven lines, each with a three-bar window, cover a fair slice of any chart. So swings land on them by sheer coverage, and random lines do the same. Our guide to backtest sample size explains why counts this big settle the question.
One more chart shows the longer reach. On USDJPY daily, A is the 30 April 2026 swing at 156.624 and B is the 6 May swing at 156.370, four bars later.
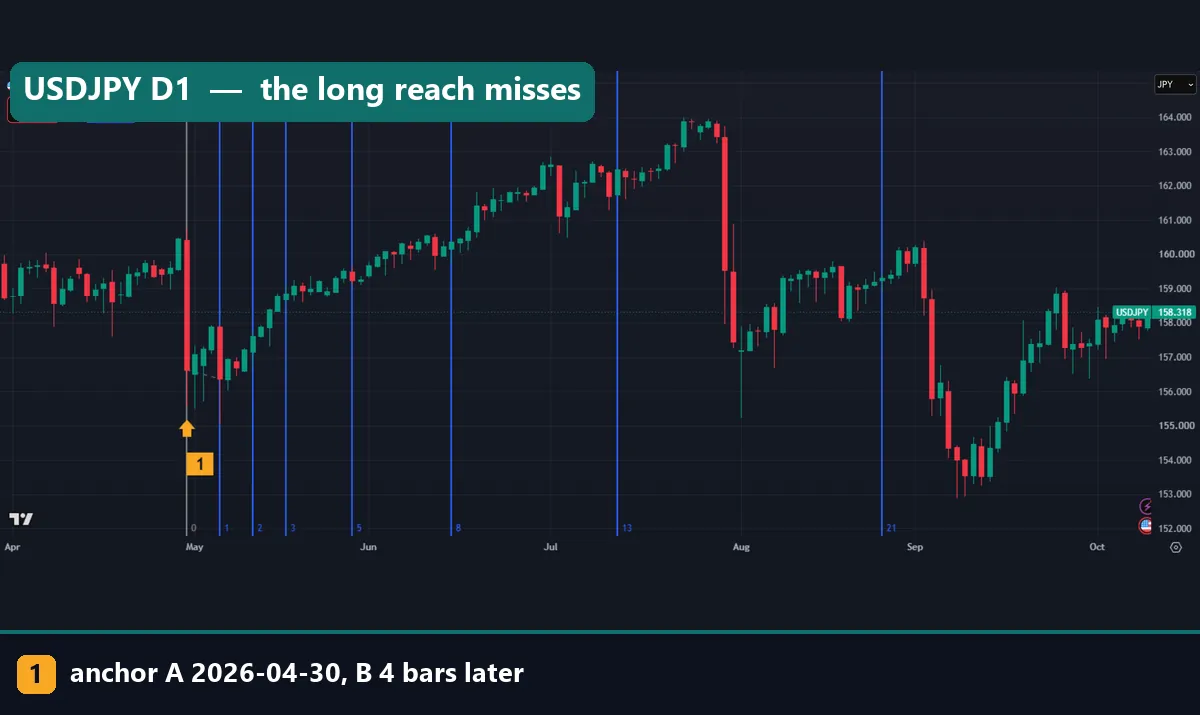
The sharp late-July drop, from near 164 on the scale, falls between lines 13 and 21. The September low, near 153, comes well after line 21. Both big events miss.
Download the complete indicator database
Put these concepts on your charts. One email unlocks the full library of 1,380+ indicators with compiled MT4 and MT5 files, plus my TradingView scripts. No paywall, no spam, unsubscribe any time.
Get free access to my indicator database
One email unlocks 1,380+ free MT4, MT5 and TradingView indicators — the complete library. No single-tool download; you get the whole database.
Where it fails
Our count gives the main failure: the lines caught swings at the same rate as random lines. Beyond that, the tool has several built-in problems.
- The anchors are a choice. Pick a different A or B and every line moves. After the fact, you can almost always find an anchor pair whose lines fit the past.
- Coverage, not foresight. Early lines bunch together, so they catch swings by density. Late lines sit far apart, so a near miss there can be days wide.
- No direction. A line does not say top or bottom. It does not even say whether a turn will come at all.
- No price. Even a hit gives you no level for an entry, a stop or a target.
- Bars, not events. A line that lands on a news day can look clever, but the news drove the move.
In short, the tool has no edge we could measure.
Why some lines still look like hits
Here are two more charts where the lines seem to work. On GBPJPY, 1-hour, A is the 23:00 UTC bar on 29 September 2026 at 208.274. B follows three bars later at 207.332.
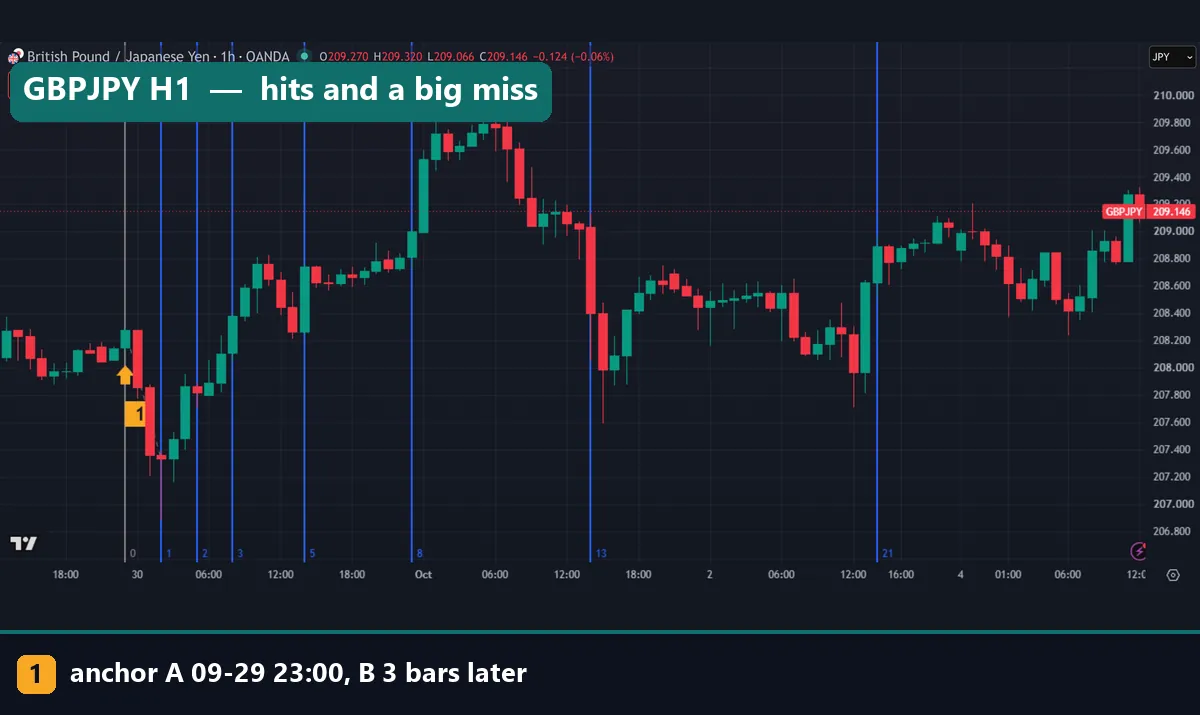
Line 13 lands on a large red candle that starts a drop. Line 21 lands on a large green candle that starts a rise. Both look impressive. Yet the session high, near 210.00 on the scale, sits between lines 8 and 13. That was the biggest turn on the chart, and no line caught it.
On AUDUSD daily, A is the 19 May 2026 swing at 0.71073 and B is the 28 May swing at 0.71628, seven bars later.
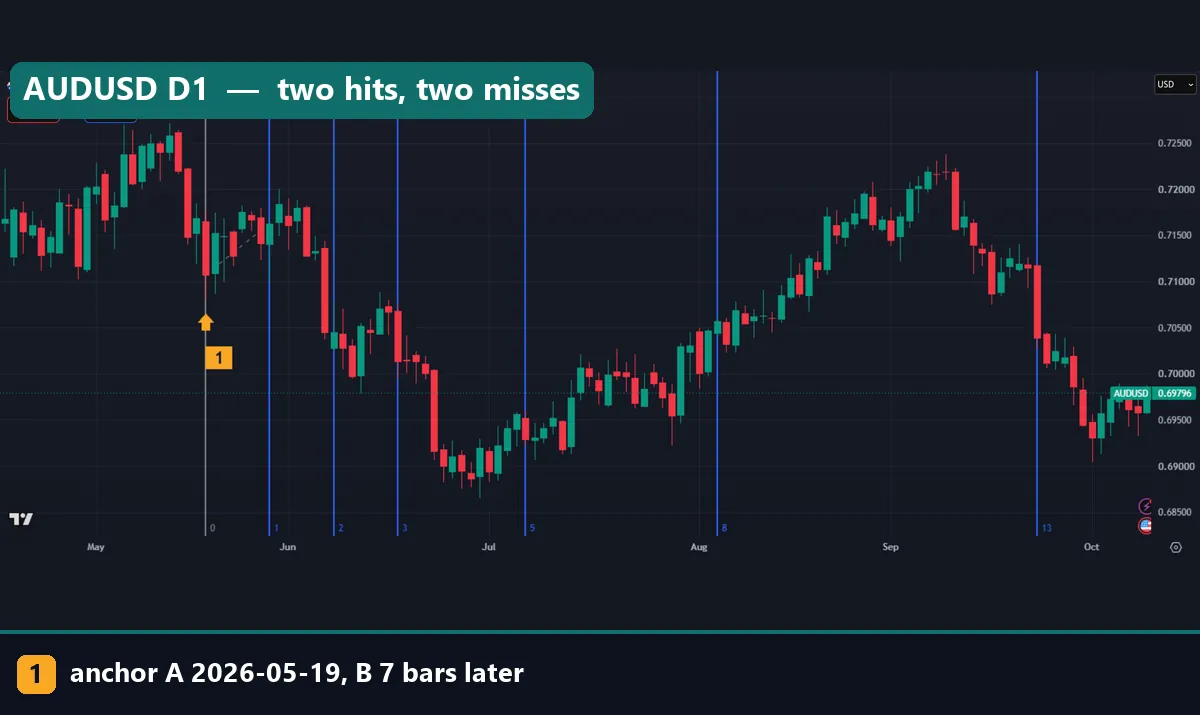
Line 2 lands on a large red candle in early June. Line 13 sits next to the start of the September slide. But the late-June low and the early-September top both fall between lines. Our memory keeps the two hits and drops the misses. That habit has a name: confirmation bias in trading.
Common mistakes with Fibonacci time zones
1. Moving the anchors after the fact. If the lines miss, it is tempting to shift A or B until they fit. That turns a forecast into a description of the past.
2. Counting near misses as hits. A swing two bars from a line feels close, yet on a daily chart that can be half a week. Set a tolerance in advance.
3. Reading a line as a direction call. A line marks a date, not a buy or sell. Price can keep trending straight through it, as it did on EURUSD at line 8.
4. Stacking it with other tools to “confirm” a setup. Adding a tool with no measured edge does not raise the odds. It only adds more ways to find a match after the fact. Our page on curve fitting in trading explains why extra filters can flatter a backtest.
If you still want to use it
Some traders like the tool as a reminder to look at a chart again on a given day. That is fair, as long as the line does not carry the decision.
If you want to test your own version, copy our setup. First, write the anchor rule down. Next, set a hit tolerance. Then place the same number of random lines and compare. Our guide on how to backtest a trading strategy walks through that process step by step.
Also, keep time tools and price tools apart in your head. Price levels from a Fib retracement tool have their own evidence question. We cover it in does Fibonacci retracement work. A good result for one would not rescue the other.
Where to go next
For the price side of Fibonacci, start with our Fibonacci calculator and the guide to the Fib golden zone. Both deal with levels, not dates, so test them on their own terms.
For a plain glossary definition, see Fibonacci Time Zones in the Babypips Forexpedia. Then compare it with the StockCharts and MQL5 pages linked above. None of them reports a hit count, but you can repeat ours with the rules above.
FAQ: Fibonacci time zones
What is a Fibonacci time zone?
A chart drawing that places vertical lines at Fibonacci multiples of the bar gap between two anchor points.
Do Fibonacci time zones work?
Not in our test: 7.3% of 126,245 daily FX swings landed on a Fibonacci line, against 7.4% on random lines.
How do I choose the two anchor points?
Most traders use two back-to-back swings; we used 11-bar swings so a fixed rule made the choice.
Does the tool count calendar days or bars?
Bars on our charts: the five-bar EURUSD gap from 8 June to 15 June 2026 spans seven calendar days.
Which timeframe suits them best?
Our count covered daily FX and found no edge; our 1-hour charts showed the same mix of hits and misses by eye.
Is there a Fibonacci time zone tool in MetaTrader?
Yes, it is a built-in chart object, listed as OBJ_FIBOTIMES in the MQL5 reference.
Does a line tell me which way price will move?
No, a line marks only a date, with no direction and no price level.
Should I trade the lines on their own?
Our data gives no reason to, since the lines matched random lines; use them at most as a reminder, and note that results are not guaranteed; past performance is not indicative of future results.
Last updated: 5 October 2026.

About the author
Written by Dominic Walsh, a Forex trader and MT4/MT5 indicator, Expert Advisor and script developer. Every tool on forexmt4systems.com is tested on live charts before release and ships with ready-to-use compiled MT4 (.ex4) and MT5 (.ex5) files. Learn more about the trader and developer behind this site.
How we build, test and correct every tool: Editorial & Testing Policy. Trading carries risk; see the disclaimer.