
The H pattern is a bearish continuation shape: a sharp drop, a weak bounce, a retest of the low, then a close below it. The inverted H is the same idea after a sharp rise. This guide settles how to define it, where its level and target sit, and what 76 daily cases on 23 forex pairs did next. In short, just over half of the bearish ones broke the low. After the break, the move looked like a coin flip.
What the H pattern is
There is no official rulebook for the H pattern. The name comes from trading courses and forums, and each draws it a little differently. Most versions share four parts.
- The drop. A fast fall from a swing high, the left leg of the H.
- The weak bounce. Buyers win back less than half of the fall.
- The second low. Sellers push price back to about the same low.
- The break. A smaller second bounce fails, and a candle closes below the lows.
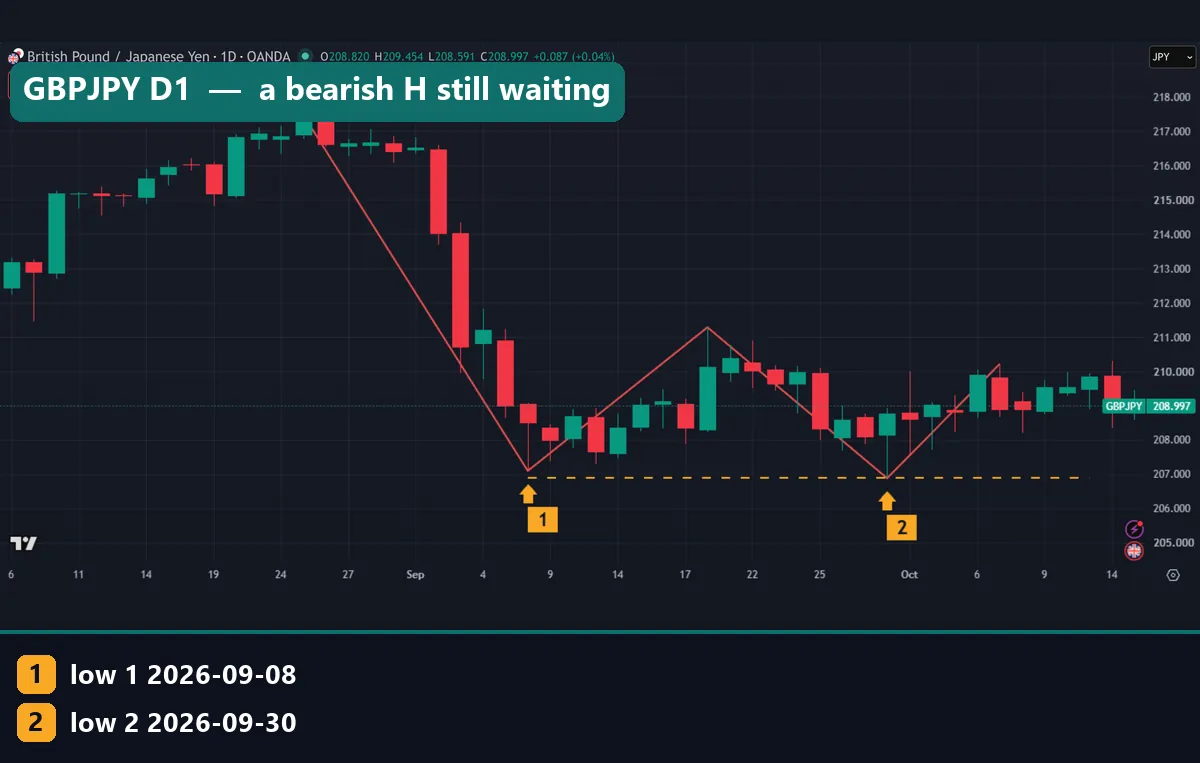
The bounce and the retest form the crossbar, though the letter is hard to see on real charts. The GBPJPY chart above looks more like a drop and a small W. A W at a low is also a double bottom pattern, which traders read as bullish. The H bets that the floor gives way.
The story behind it is the dead-cat bounce, which Thomas Bulkowski covers on his dead-cat bounce page at ThePatternSite. His data comes from stocks, so we do not borrow his numbers.
The H also looks like a bear flag. But a flag is a small channel that slopes against the trend, as the flag and pennant article at StockCharts ChartSchool shows. An H has two lows at about the same price instead. Our flag pattern guide covers the flag.
How the H pattern works: levels and target
Here is the arithmetic for the bearish H.
drop = start high - low 1
bounce = bounce high - low 1
level = lower of low 1 and low 2
target = level - bounce
The bounce must stay under half the drop. The target works as a measured move: the bounce height, projected down from the level. Our guide to measured move targets explains the method. So the target always sits closer than the first fall.
A close back above the bounce high voids the H, and most write-ups put the stop there. The entry comes at or below the lowest low, so the risk is at least the bounce height. Yet the target equals the bounce height. Before costs, the textbook trade offers 1 to 1 at best.
The inverted H flips every step: a fast rise, a shallow dip, a second high near the first, then a close above the higher high. A close below the dip low cancels it.
How we tested the H pattern
Patterns picked by eye favour the ones that worked, so every case came from one fixed rule.
For the statistics we used MetaTrader 4, build 1471, with Capital Point Trading terminal history. That gave us daily bars on 23 forex pairs, from 12 June 2018 to 24 August 2026. We also scanned hourly bars on EURUSD, GBPUSD and USDJPY from 22 December 2025 to August 2026. For gold (XAUUSD), the hourly data ran from 1 July 2025 to 20 August 2026.
The chart examples use the TradingView web chart with OANDA data, captured on 15 October 2026. They cover GBPJPY and USDCHF on D1, gold on H1 and M15, and USDJPY on M15. Every line and marker comes from our own measurement.
We placed no trades. Instead, we counted what price did next. All results are before spread, swap and commission, and our note on backtesting transaction costs explains why that matters. The full method sits in our editorial testing policy. Also, MT4 and OANDA only show tick volume, which counts price changes, so we left volume out.
Our H pattern rules and settings
Here is the exact rule set. Change any number and you get a different sample.
| Parameter | Our setting | Why it matters |
|---|---|---|
| Swing points | 3-bar swing highs and lows | Extreme of 3 bars each side |
| Drop | At least 3 ATR, within 15 bars | Only fast, large falls |
| Bounce | Under half the drop | The “weak” in weak bounce |
| Second low | Within 0.5 ATR of the first | Same floor, scaled to volatility |
| Second high | At most 0.25 ATR above the bounce high | The second bounce must fail |
| Level | The lower of the two lows | The line a close must break |
| Break window | A close below the level within 20 bars, from 3 bars after the second high | After that, no break |
| Cancel | Any close above the bounce high first | The pattern is void |
| Target | Level minus bounce, within 30 bars | A wick touch counts |
| Follow-through | Close 10 bars after the break | Did the move continue? |
| ATR | 14 bars, plain average of true range | Scales every distance |
The inverted H uses the same numbers, mirrored. A swing needs three bars on each side, so the rule sees it three bars late. For ATR, see what ATR means in trading or TradingView’s average true range help page. For swings, our guide to peaks and troughs shows how highs and lows define a trend.
Reading the H pattern on a chart
On our charts, the coloured line traces the swing path: red for a bearish H, green for an inverted H. The yellow dashed line marks the level that has to break. Markers 1 and 2 sit on the two lows or highs. Marker 3 shows the recorded break close.
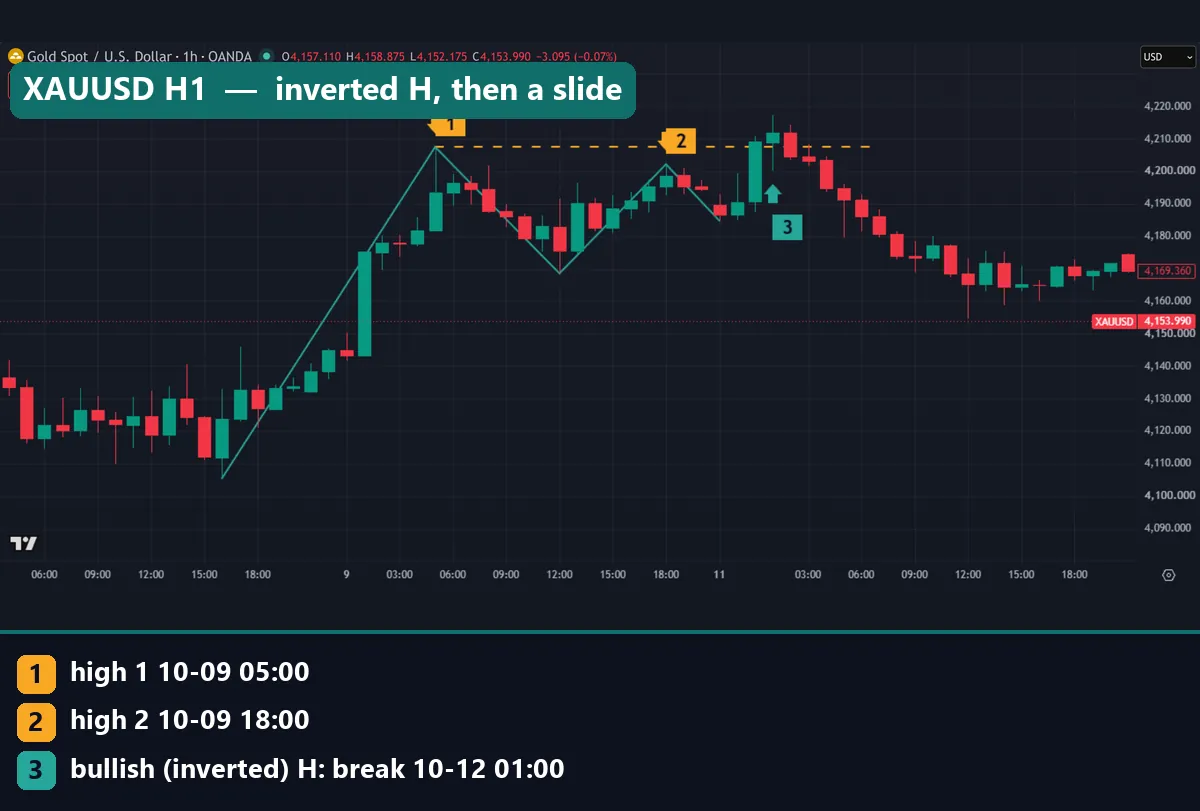
This inverted H formed on the gold hourly chart. Gold rose from $4,105.50 on 8 October. It peaked at $4,207.49 at 05:00 UTC on 9 October, marker 1. Next, it dipped $38.92 to $4,168.57 and made a second high at $4,202.18, marker 2.
At 01:00 UTC on 12 October, a candle closed at $4,211.97 above the level, marker 3. The target sat at $4,246.40, the level plus the dip, and gold never got there. It topped just under the $4,220 gridline. Ten bars after the break, it traded below $4,180.
A 15-minute inverted H on USDJPY
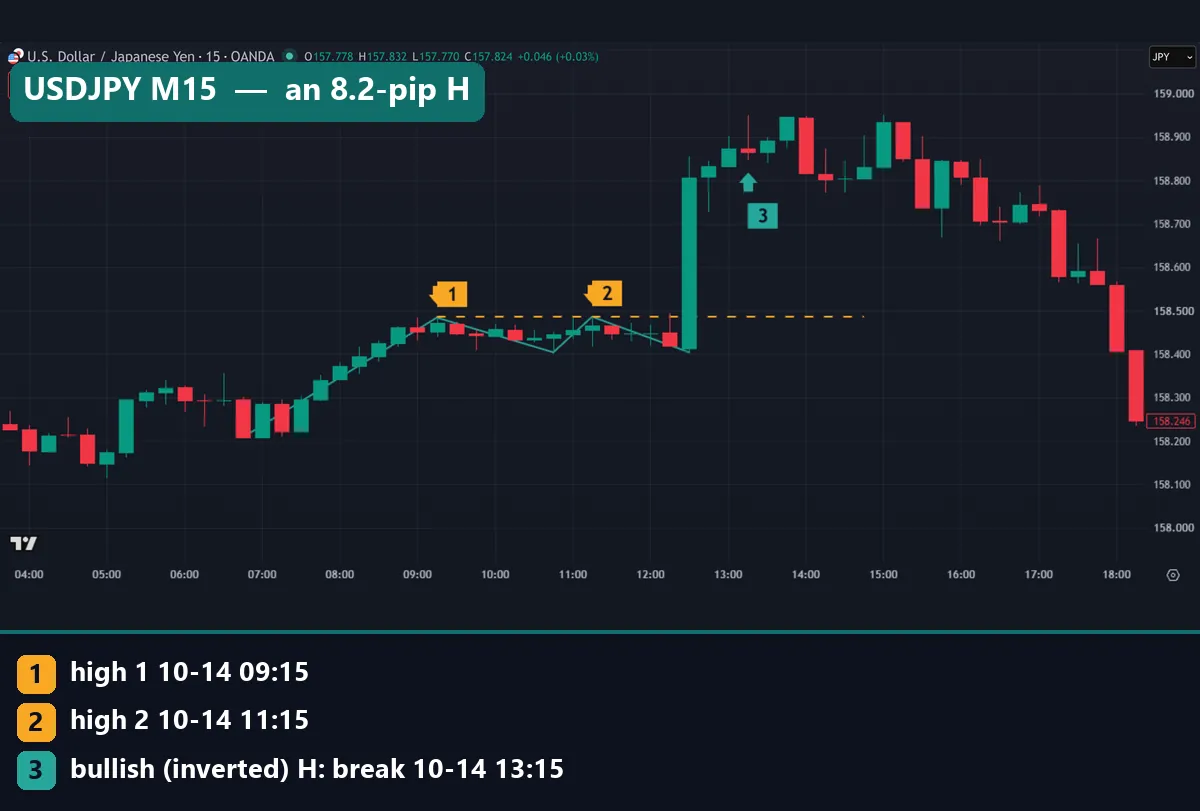
USDJPY on 14 October 2026 shows how small these get on M15. Price rose 27.6 pips into the first high at 09:15 UTC. The highs at 158.484 and 158.486 sat 0.2 pips apart, and both dips held at 158.404. So the whole H stood 8.2 pips tall.
At 12:30, one candle jumped from the lows to about 158.800. That same candle printed the second low. Our rule waits three bars to confirm a swing, so it logged the break at 13:15, at 158.865. It had already passed the 158.566 target. By 18:15 UTC, it sat at 158.246, under both lows.
Worked example: the GBPJPY daily H
Here is the pattern from the top of the page, step by step.
- Start: a swing high at 217.478 on 25 August 2026.
- Low 1: 207.1 on 8 September, a drop of 10.378 yen (1,037.8 pips).
- Bounce high: 211.284 on 18 September, a bounce of 4.184 yen, or 40.3% of the drop.
- Low 2: 206.885 on 30 September, 0.215 yen under low 1.
- Second high: 210.209 on 7 October, below the bounce high.
- Level and target: 206.885, and 206.885 minus 4.184 gives 202.701.
- Cancel: a close above 211.284.
Now check the textbook trade. A sell on a close under 206.885, with a stop above 211.284, risks at least 4.399 yen. The target sits at most 4.184 yen away. So the reward falls short of the risk before any cost.
And the result? As of our capture on 15 October, the last close stood at 208.997. Price had not closed below 206.885 or above 211.284. So the pattern stayed open, with its 20-bar window running into early November. We cannot tell you how it ends.
What 76 daily H patterns did
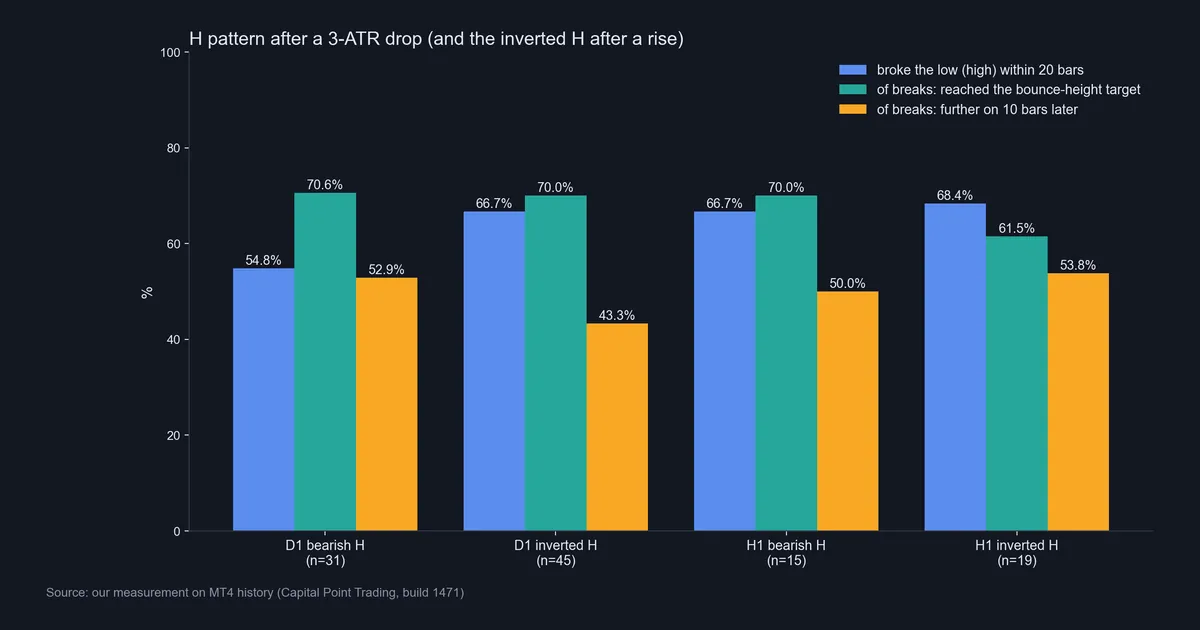
Our scan found 31 bearish H patterns and 45 inverted ones on the 23 daily pairs. That is fewer than 10 a year across the whole set.
For the bearish H, 54.8% closed through the low in time, or 17 of 31. Of those 17 breaks, 70.6% touched the target within 30 bars. But only 52.9%, or 9 of 17, sat further down 10 bars later. For comparison, any day on these pairs closed higher 10 days later 52.3% of the time, so lower about 47.7%.
The inverted H looked worse. It broke in 66.7% of cases, 30 of 45, and 70.0% of those breaks hit the target. Yet only 43.3% sat higher 10 bars later. By then, the median break had given back 0.54 ATR.
So the target figure flatters the pattern. The target sits close, and any wick in 30 bars counts. By contrast, the 10-bar figure uses closes, and it hovers near chance. The hourly scan agrees. From 15 bearish and 19 inverted cases, 50.0% and 53.8% of breaks moved further on. Samples this small settle little, as our note on backtest sample size explains.
Gold M15: a bearish H that turned into a rally
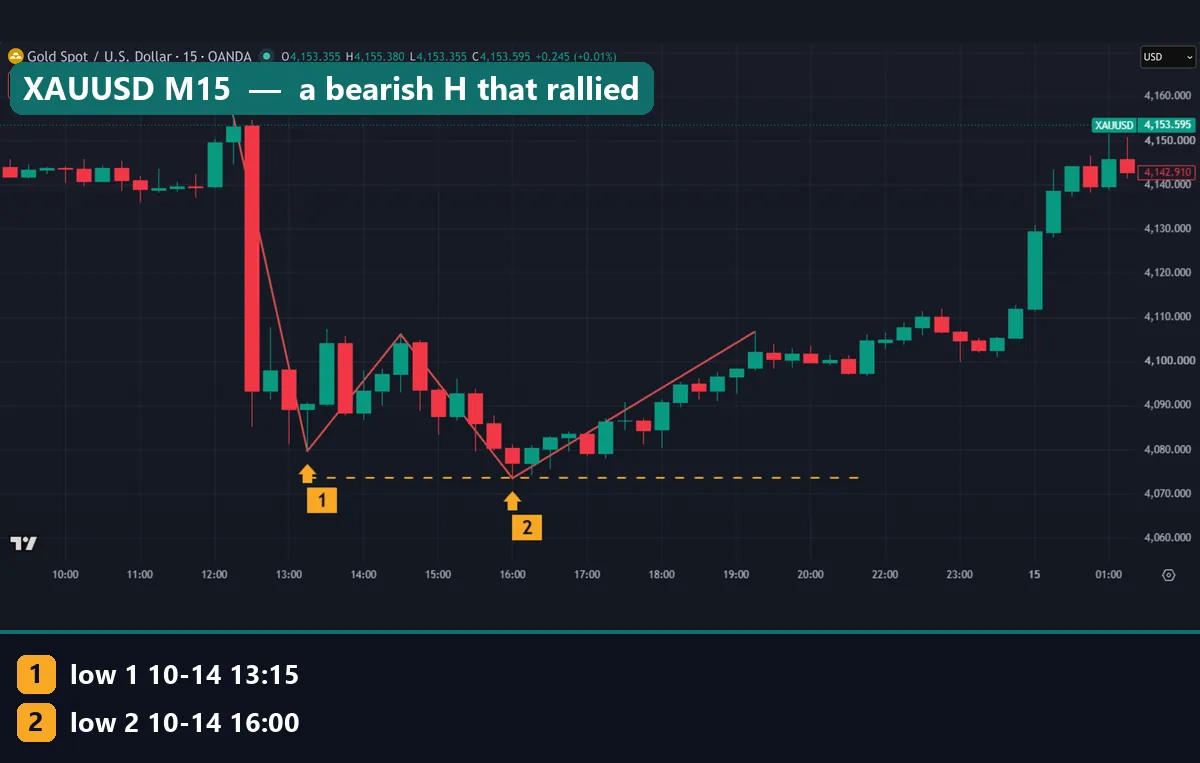
Now a bearish H that failed. On 14 October, gold fell about $76 in one hour. It hit $4,079.73 at 13:15 UTC, marker 1, then bounced to $4,106.12, about a third of the drop. The second low came at $4,073.55 at 16:00, marker 2.
The second high reached $4,106.71, just $0.59 over the bounce high. Our 0.25 ATR allowance let that pass. But before midnight UTC, gold closed above $4,106.12, and the H was void. The last bar in the shot, at 01:15 UTC on 15 October, closed at $4,142.91.
Download the complete indicator database
Put these concepts on your charts. One email unlocks the full library of 1,380+ indicators with compiled MT4 and MT5 files, plus my TradingView scripts. No paywall, no spam, unsubscribe any time.
Get free access to my indicator database
One email unlocks 1,380+ free MT4, MT5 and TradingView indicators — the complete library. No single-tool download; you get the whole database.
Where it fails
Four things go wrong in our data.
- The break leads nowhere special. Of daily bearish breaks, 52.9% moved on 10 bars later. Of inverted breaks, only 43.3% did.
- Many never break. 45.2% of daily bearish H patterns did not close through the low in time.
- The samples are tiny. We found 76 daily and 34 hourly cases in total. One rule change could swing every figure.
- The rule lags, and the name is loose. A swing needs three bars to confirm, and other traders use other thresholds.
Above all, a neat H feels like proof that sellers are in control. Our numbers do not show that. If you only remember the clean breaks, read about confirmation bias in trading.
Two more charts where this fails
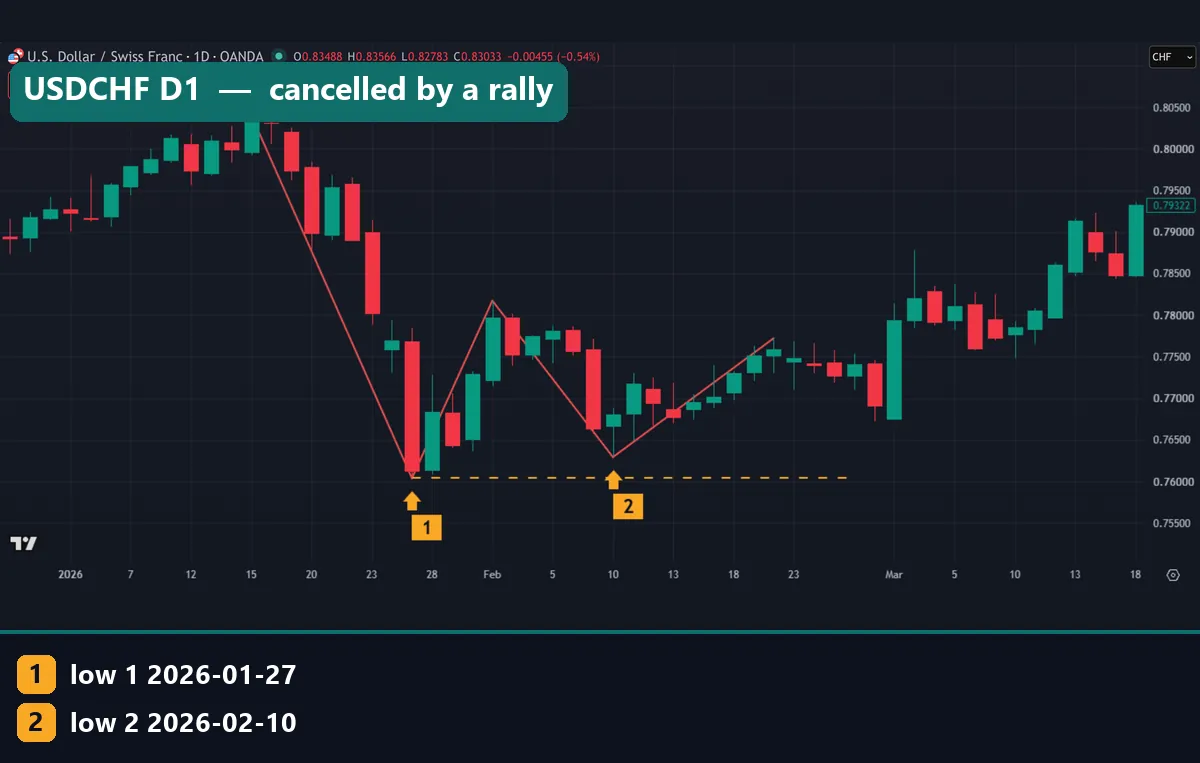
USDCHF fell 437.1 pips in under two weeks, to 0.76038 on 27 January 2026, marker 1. It bounced to 0.78174, or 48.9% of the drop, just inside our half limit. The second low held at 0.76292 on 10 February, marker 2.
Price never closed under the 0.76038 level. Instead, in March it closed back above 0.78174, which cancels the H. The last bar in the shot closed at 0.79322.
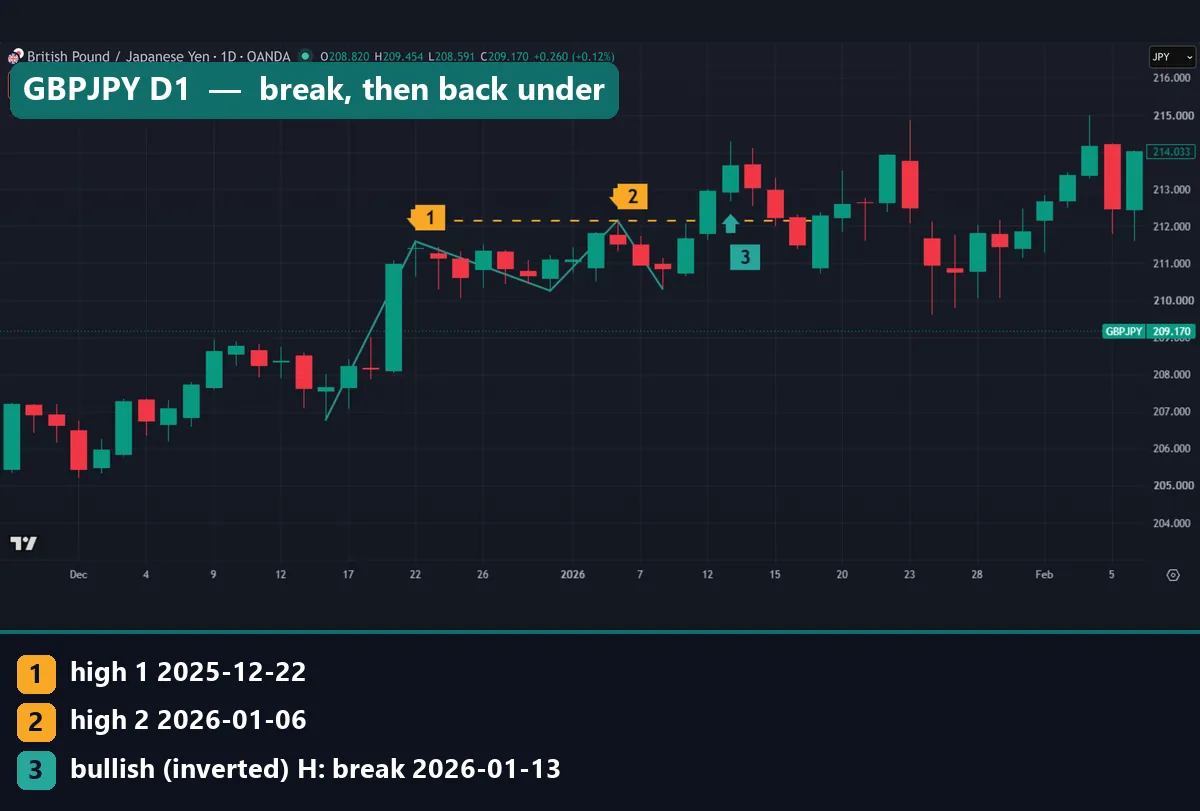
GBPJPY shows an inverted H that did break. Price rose to 211.594 on 22 December 2025, marker 1, and dipped to 210.262. Then it made a higher second high at 212.159 on 6 January 2026, marker 2. On 13 January, a close at 213.651 broke that level, marker 3, already past the 213.491 target. Yet by the third bar after it, price had closed back under 212.159. Ten bars on, it traded near 211.
Common mistakes with the H pattern
- Selling the second low. Until a candle closes below the level, the H is just a range. In our daily test, 45.2% of bearish cases never did.
- Treating a target touch as success. Of the daily bearish breaks, 70.6% touched the target, but only 52.9% sat further on 10 bars later.
- Placing a stop the target cannot pay for. A stop above the bounce high never sits closer than the target. Size the trade to that distance, as our guide to ATR stop loss distance explains. Our break and retest strategy test also shows how often first breaks fail.
- Trading tiny M15 shapes. The USDJPY example stood 8.2 pips tall, so spread and commission eat a large share of any move.
Where to go next
The bearish H is a double bottom that fails, and the inverted H is a double top pattern that fails. For continuation shapes with a tighter definition, compare a flag vs a pennant. Our ZigZag formula guide marks swings much as our rule does. And our guide to market structure in forex covers lower highs and lower lows.
If you code your own scan in MT4, the iATR function in the MQL4 documentation returns the ATR these rules depend on.
FAQ about the H pattern
Is the H pattern bullish or bearish?
The standard H pattern is bearish: it expects a fall to continue after a weak bounce. The inverted H is the bullish mirror.
How do you measure the H pattern target?
Subtract the bounce height, from the first low to the bounce high, from the lower of the two lows. In our GBPJPY example, 206.885 minus 4.184 gives 202.701.
Where does the stop go on an H pattern?
Most write-ups put it above the first bounce high. So the stop sits at least as far away as the target, and the trade offers 1 to 1 at best.
How often does the H pattern break the low?
In our daily test, 54.8% of 31 bearish patterns closed below the level within 20 bars. On the hourly charts, 66.7% of 15 did. Both samples are small.
Is the H pattern the same as a bear flag?
No. A bear flag is a small channel that slopes up against the fall. An H has two lows at about the same price.
Does the inverted H pattern work better?
Not in our data. Of 45 daily inverted H patterns, 66.7% broke the level, but only 43.3% of breaks sat higher 10 bars later.
Which timeframe suits the H pattern?
Neither D1 nor H1 showed a clear edge after the break in our test. On M15 the shapes get tiny, so costs bite harder.
Does the H pattern work in forex?
In our test, the shape appeared rarely, and the move after the break sat close to a coin flip. Use it as a map of levels, not as a signal. All figures here are before costs; results are not guaranteed; past performance is not indicative of future results.
Last updated: 15 October 2026.

About the author
Written by Dominic Walsh, a Forex trader and MT4/MT5 indicator, Expert Advisor and script developer. Every tool on forexmt4systems.com is tested on live charts before release and ships with ready-to-use compiled MT4 (.ex4) and MT5 (.ex5) files. Learn more about the trader and developer behind this site.
How we build, test and correct every tool: Editorial & Testing Policy. Trading carries risk; see the disclaimer.