
A high wave candlestick is a candle with a small body and long wicks on both sides, and this guide settles what it really tells a forex trader. We counted 648 of them on 23 daily currency pairs and 1,738 on 15-minute charts. Then we checked what price did next. The short answer is plain. The candle says little about direction, but the bar after it tends to be larger than a normal bar.
What a high wave candlestick is
A high wave candle has three parts that matter. First, the body is small, so the open and the close sit close together. Second, the upper wick is long. Third, the lower wick is long too. In short, price travelled far both ways and then settled near where it started.
The colour does not matter, because the body is too small to carry a message. What carries the message is the total range. A high wave is a wide bar, not a quiet one. Most short definitions skip that detail.
Thomas Bulkowski keeps a page on the high wave candle at ThePatternSite. He notes that it acts as a reversal about 51% of the time in his stock data, which he calls close to random. Our forex numbers land in a similar place on short timeframes.
High wave vs doji, spinning top and long-legged doji
These shapes overlap, so it helps to separate them. A doji has almost no body at all. We cover that shape in our page on what a doji candle means, so we will not repeat it here.
A long-legged doji is a doji with long wicks. A high wave looks similar, but it keeps a small, visible body. A spinning top also has a small body, yet its wicks can be modest. So the high wave is the spinning top’s wilder cousin: same small body, longer wicks, and a wide range.
Charting tools often label these shapes differently, so we wrote a fixed rule before we counted anything. For the wider family, see candlestick patterns explained and our candlestick wicks guide.
How the high wave candle forms
Think about the session behind the bar. Buyers push price well above the open. Then sellers push it well below. Neither side holds its ground, so the close lands near the open. We turned that idea into four checks:
range = high - low, at least 1 x ATR(14).body = abs(close - open), at most 20% of the range.upper wick = high - max(open, close), at least 30% of the range.lower wick = min(open, close) - low, at least 30% of the range.
The ATR check matters most. Without it, a sleepy bar with a small body would pass. ATR, the average true range, measures how far price usually moves per bar. TradingView explains it in its Average True Range help page, and our ATR guide shows how traders use it.
How we tested
We ran two measurements on our MetaTrader 4 terminal, build 1471, with Capital Point Trading history. The first used 23 FX pairs on daily bars from 12 June 2018 to 24 August 2026, a total of 37,748 candles. The second used 15-minute bars from June 2025 to August 2026. Our M15 chart lists EURUSD, GBPUSD, USDJPY and XAUUSD.
For each high wave, the five bars before it set the prior trend. Then we asked one question: N bars later, did price close on the other side of the high wave’s close? On daily bars we checked 1, 3 and 5 bars later. On M15 we checked 1, 4 and 8 bars. We ran the same test on every bar, so each result has a base rate. We also measured the next bar’s size in ATR units.
Finally, we marked real examples on the TradingView web chart on 5 October 2026, using OANDA data. The MT4 history does not store usable spreads, so all counts are before spread, swap and commission. They are direction counts, not trade results. Our editorial testing policy explains how we run these checks.
The rule we used, parameter by parameter
Every value below feeds our counts. Change one and the counts change too.
| Parameter | Our value | What it does |
|---|---|---|
| ATR period | 14 bars | Sets the yardstick for a wide bar |
| Minimum range | 1 x ATR(14) | Rejects quiet bars |
| Maximum body | 20% of the range | Keeps open and close together |
| Minimum upper wick | 30% of the range | Needs a real push higher |
| Minimum lower wick | 30% of the range | Needs a real push lower |
| Prior trend | 5 bars | Decides what reversal means |
| Look-ahead, daily | 1, 3 and 5 bars | Short-term follow-through |
| Look-ahead, M15 | 1, 4 and 8 bars | 15 minutes to two hours |
With these settings, the shape is not rare. We found 17.5 high waves per 1,000 daily bars and 20.4 per 1,000 M15 bars.
Reading a high wave candle on a chart
Start with the wicks, not the colour. Look for a bar clearly taller than its neighbours, with a small body near the middle. Then check where it sits.
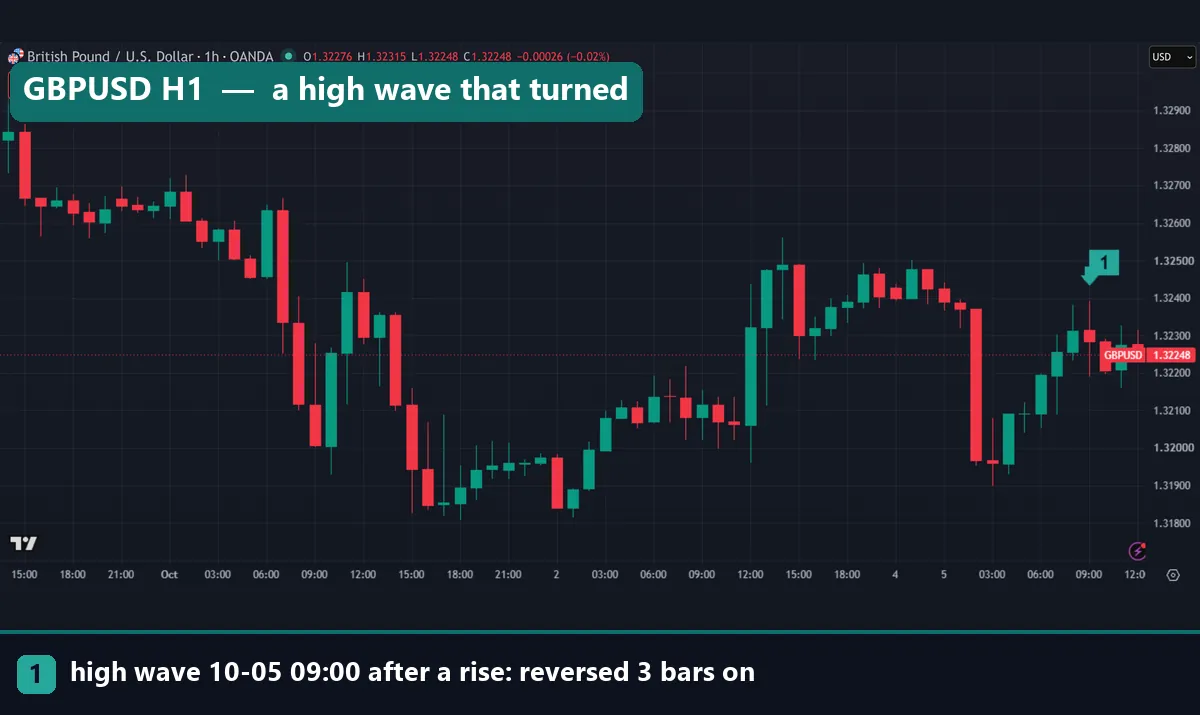
On GBPUSD H1, the 09:00 UTC bar on 5 October 2026 came after a rise. It opened at 1.32314, reached 1.32392, fell to 1.32191 and closed at 1.32284. So the range was 20.1 pips and the body 3.0 pips, about 15% of the range. Three bars on, price had closed below it, so it counted as a reversal.
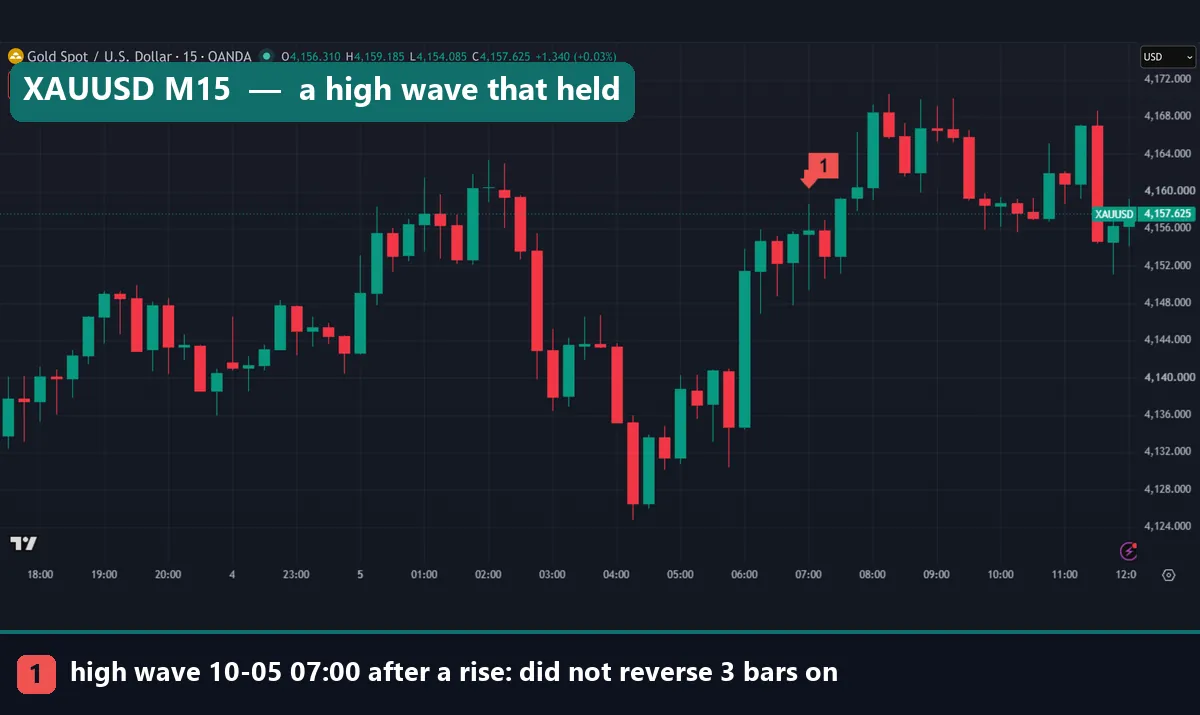
Gold shows the other outcome. The XAUUSD 15-minute bar at 07:00 UTC on 5 October 2026 also followed a rise. Its range was about $9.26, with a body of only $0.36. Yet three bars later, price had not closed below it. Instead, gold pushed higher in the next hour.
Same shape, opposite result. The candle tells you the session was contested, not who wins next. For that, traders look at location, as in our guide to candlestick patterns at support and resistance.
Worked example: EURUSD daily, 29 May 2026
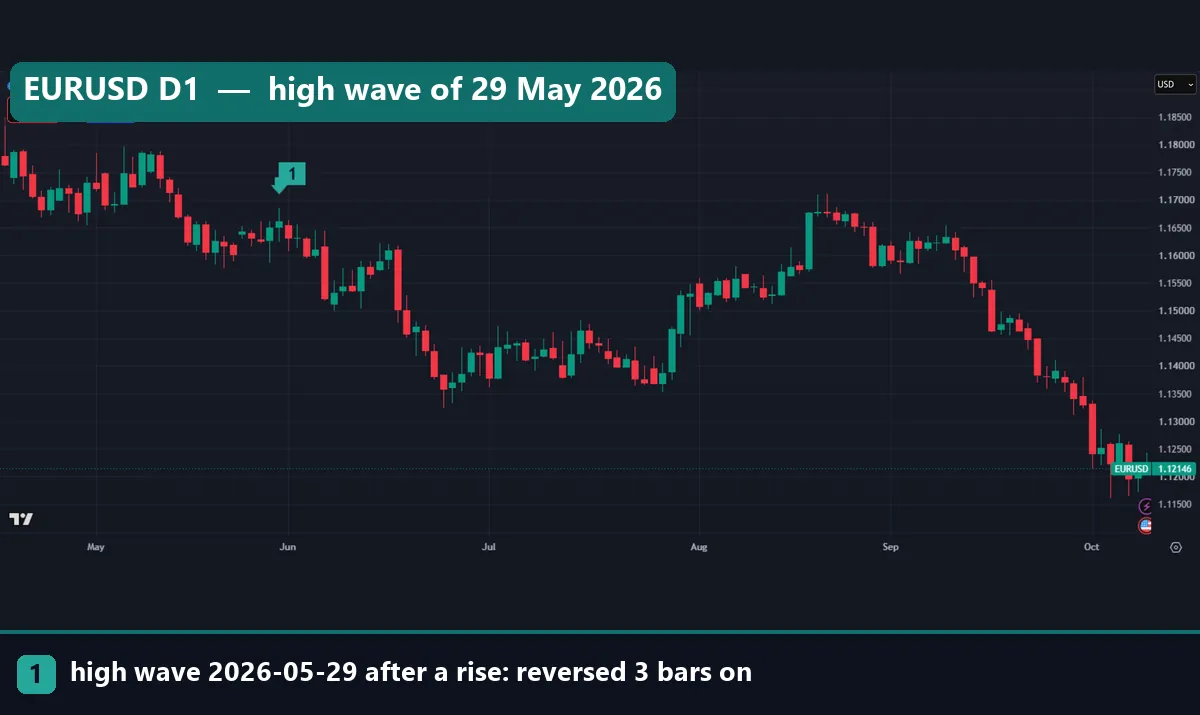
The first chart in this guide marks a daily high wave on EURUSD. It printed on 29 May 2026, after a five-bar rise. Here are its OANDA prices:
- Open 1.16522, high 1.16859, low 1.16250, close 1.16621.
- Range: 1.16859 minus 1.16250 is 60.9 pips.
- Body: 1.16621 minus 1.16522 is 9.9 pips, about 16% of the range.
- Upper wick: 23.8 pips, about 39% of the range.
- Lower wick: 27.2 pips, about 45% of the range.
So the bar passes all three shape checks with room to spare. Our script also flagged it against ATR(14), so it was wide for its time.
Three bars on, price had closed below 1.16621, a reversal of the prior rise. The chart then shows EURUSD sliding through June. Still, one example proves nothing. On the day, nobody could know which way it would break. That is why the counts below matter more.
What our measurement found
On daily FX, the high wave leaned slightly toward reversal. After 648 high waves, price closed on the other side of the prior trend 53.5% of the time one bar later, against a 49.7% base. Three bars later it was 53.1% against 50.0%. Five bars later it was 56.8% against 50.5%.
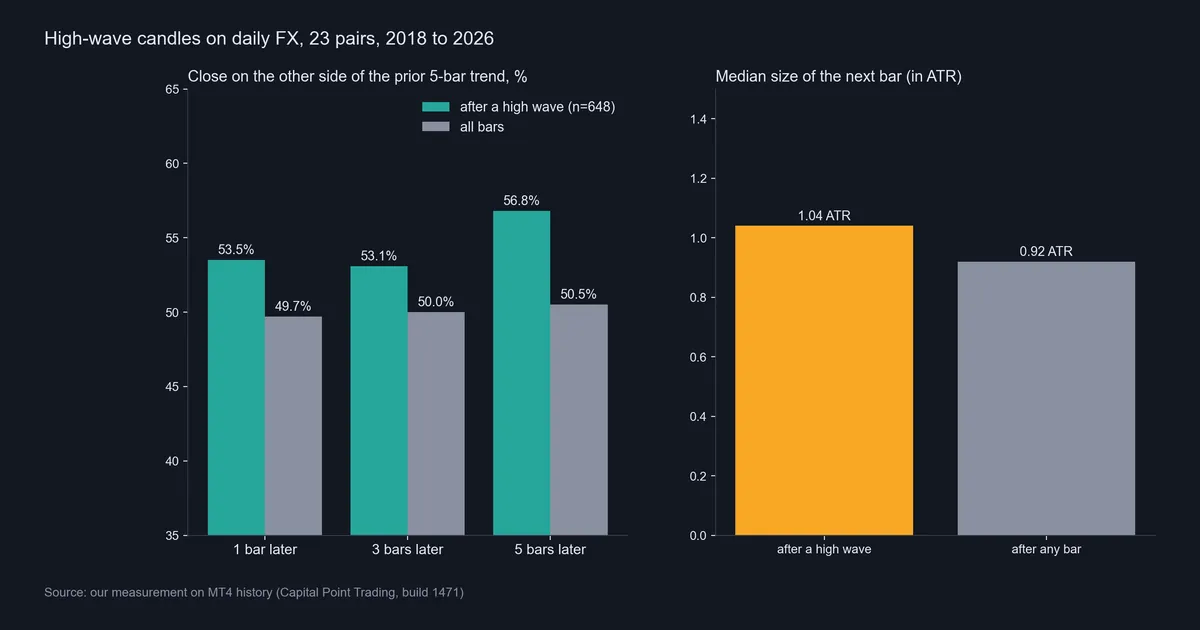
That is a modest lean from one broker’s history, and we have not tested it out of sample. So treat it as a lead to check, not a strategy that works. The size result is clearer. The bar after a daily high wave had a median size of 1.04 ATR, against 0.92 ATR after any bar.
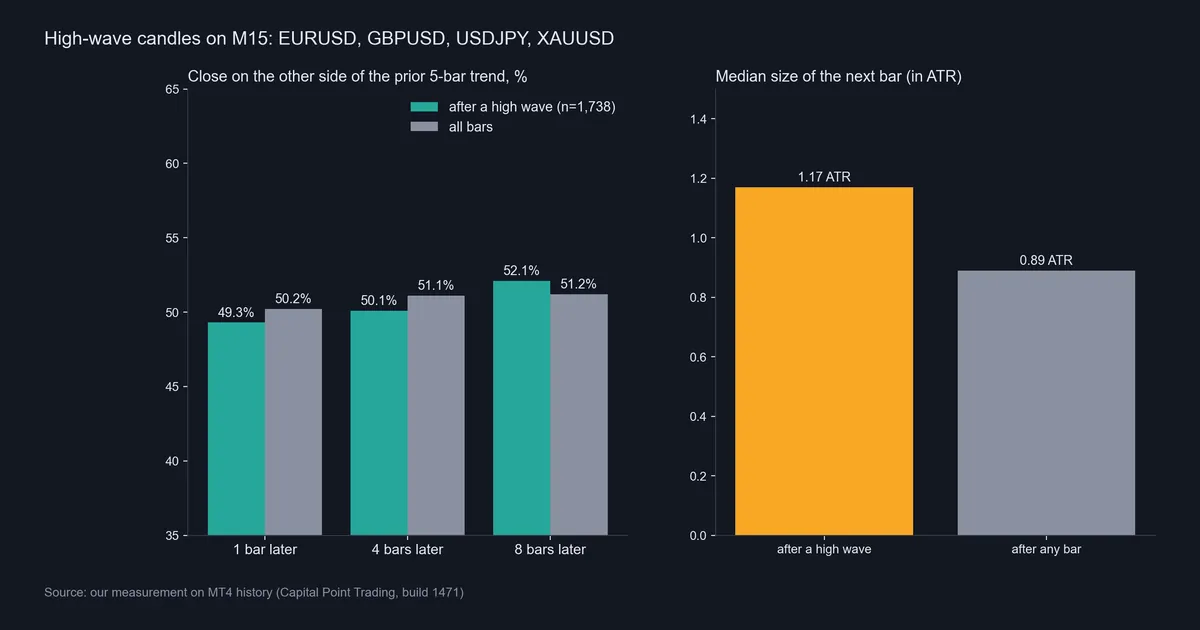
On M15, the direction lean disappeared. Across 1,738 high waves, the reversal share was 49.3% one bar later against a 50.2% base. At four bars it was 50.1% against 51.1%, and at eight bars 52.1% against 51.2%. However, the size effect grew: 1.17 ATR after a high wave, against 0.89 ATR after any bar.
Our reading: a high wave is a volatility signal first. Direction is mostly a guess, especially intraday.
Download the complete indicator database
Put these concepts on your charts. One email unlocks the full library of 1,380+ indicators with compiled MT4 and MT5 files, plus my TradingView scripts. No paywall, no spam, unsubscribe any time.
Get free access to my indicator database
One email unlocks 1,380+ free MT4, MT5 and TradingView indicators — the complete library. No single-tool download; you get the whole database.
Where it fails
First, it fails as a direction call on short timeframes. On M15, our reversal shares sat within about one point of the base rate at every horizon. Trading those bars as reversals means trading noise.
Second, the daily lean is small and unproven. A few points above 50% can come from chance in a sample of 648. It can also vanish once costs come in. We did not test entries, stops or exits, so we cannot say whether any plan would cover spread and swap. Our page on backtesting transaction costs shows how fast small edges shrink.
Third, the shape depends on the feed. Broker session times change the daily open and close, so a bar can pass on one feed and fail on another. Fourth, the wider next bar says nothing about its direction. Finally, the cut-offs are our choice. Other authors use different ones, so their counts differ.
Two more charts: one held, one turned
Both cases passed the same rule, and they ended in opposite ways.
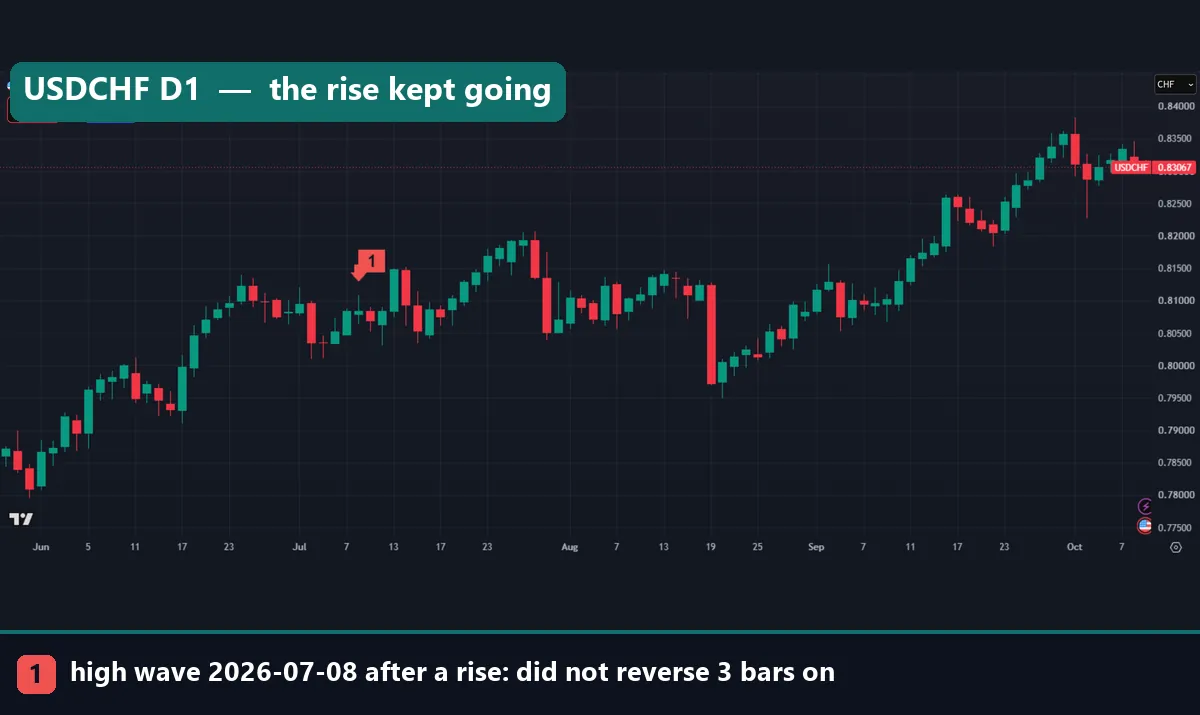
USDCHF printed a daily high wave on 8 July 2026 after a rise. It opened at 0.80791, hit 0.81081, dropped to 0.80638 and closed at 0.80843. The range was 44.3 pips and the body just 5.2 pips. Even so, price did not reverse within three bars. Instead, the chart shows USDCHF climbing toward 0.82 later in July.
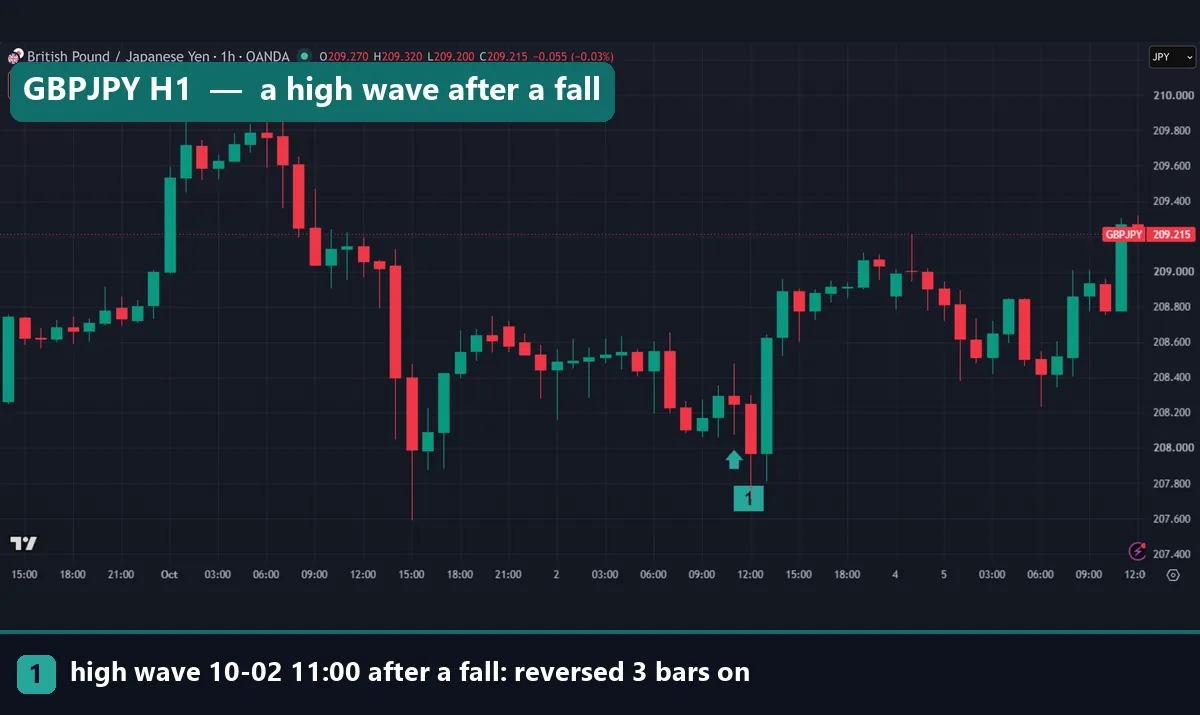
GBPJPY gives the opposite case. Its hourly high wave at 11:00 UTC on 2 October 2026 came after a fall. It opened at 208.294, reached 208.479, dipped to 208.074 and closed at 208.249. Three bars later, price had closed above it, so it counted as a reversal.
Both cases share one thing: the bars right after them were busy. That fits the size result far better than any direction rule.
A more useful reading: expect a wider next bar
If the high wave has one practical use, it is as a warning about size. The next bar tends to run wider than normal: 1.04 ATR against 0.92 on daily FX, and 1.17 against 0.89 on M15.
So a careful trader might check open trades when a high wave closes. A stop set for quiet conditions may sit too close. Our guide on ATR stop-loss distance shows one way to scale stops to volatility. To compare pairs, the forex volatility calculator gives a quick view of typical ranges. None of this predicts direction, though.
Common mistakes with the high wave candle
1. Calling every small body a high wave. Without the ATR filter, quiet bars slip in. A small body on a narrow bar is just a slow session.
2. Trading it as an intraday reversal. Our M15 data showed no lean at all. On that timeframe, the shape fits a coin flip better than a signal.
3. Ignoring location. A high wave mid-range carries less weight than one at a clear swing point. Even so, we did not measure location, so treat that as habit, not a result.
4. Judging from a few charts. Our five marked examples split three reversals and two holds. That proves nothing. Instead, count hundreds of cases with a fixed rule, as our backtest sample size guide explains.
Where to go next
To read candles faster, start with how to read candlestick charts. The Japanese candlestick cheat sheet puts common shapes on one page. For the big-picture question, see do candlestick patterns work.
For related shapes, compare the gravestone candlestick and the pin bar. If you prefer software, the candlestick pattern detector indicator scans for common patterns.
Outside our site, read the introduction to candlesticks at StockCharts ChartSchool and the average true range article on Wikipedia.
FAQ
Is a high wave candlestick bullish or bearish?
Neither. The body is too small to show a winner. It marks a session where price moved far both ways and settled near the open.
How is a high wave different from a doji?
A doji has almost no body. A high wave keeps a small, visible body, up to 20% of the range in our rule. Both can have long wicks.
Does a high wave candle signal a reversal?
Only weakly on daily FX, and not on M15 in our data. Daily high waves reversed the prior trend 53.1% of the time three bars later, against a 50.0% base rate.
What does a high wave candle tell me about volatility?
It suggests a wider next bar. After a daily high wave, the next bar had a median size of 1.04 ATR, against 0.92 ATR after any bar.
How often does a high wave candle appear?
With our rule, we found 17.5 per 1,000 daily bars across 23 pairs and 20.4 per 1,000 bars on M15.
Which timeframe works best for the high wave?
Only the daily chart showed a direction lean, and it was small. The size effect showed up on both daily and M15 charts.
Can I find high wave candles automatically in MT4?
Yes, a pattern scanner can flag them, but check its rule first. Many tools skip the ATR filter, so they also mark quiet bars.
Should I trade the high wave candlestick on its own?
Our data does not support that. The direction lean was modest on daily bars, absent on M15, and measured before costs. Use it as a volatility warning and test any plan on your own data; results are not guaranteed; past performance is not indicative of future results.
Last updated: 5 October 2026.

About the author
Written by Dominic Walsh, a Forex trader and MT4/MT5 indicator, Expert Advisor and script developer. Every tool on forexmt4systems.com is tested on live charts before release and ships with ready-to-use compiled MT4 (.ex4) and MT5 (.ex5) files. Learn more about the trader and developer behind this site.
How we build, test and correct every tool: Editorial & Testing Policy. Trading carries risk; see the disclaimer.