
IPDA ICT is the label ICT traders use for the 20, 40 and 60-day look-back ranges they mark on a daily chart. This guide settles two things. First, what the idea claims and what it does not. Second, how often those ranges actually broke on 23 FX pairs over eight years of daily data. We drew the ranges on six live charts from 2 September 2026, then counted what price did next.
IPDA ICT: what the term means
IPDA stands for “interbank price delivery algorithm”. The phrase comes from Michael J. Huddleston, who teaches under the name Inner Circle Trader (ICT). In his telling, an algorithm delivers price toward liquidity above old highs and below old lows.
That said, no bank, regulator or exchange has published such an algorithm. FX is a dealer market spread across many banks, platforms and brokers. The BIS Triennial Survey of FX turnover describes that structure in detail, and it names no single price engine. Also, the industry’s own FX Global Code from the Global Foreign Exchange Committee sets conduct rules for many competing dealers. In short, treat IPDA as a teaching model, not as a fact about how the market is wired.
Still, the practical part is testable. ICT students mark the highest high and lowest low of the last 20, 40 and 60 trading days, the “data ranges”. If you are new to the vocabulary, our glossary of ICT terms and the primer on what ICT trading is cover the basics first.
How the 20, 40 and 60-day look-back ranges work
For a chosen reference day, you look back N trading days and take the extremes. The formula is the one behind a Donchian channel:
Upper(N) = highest high of the last N daily barsLower(N) = lowest low of the last N daily bars
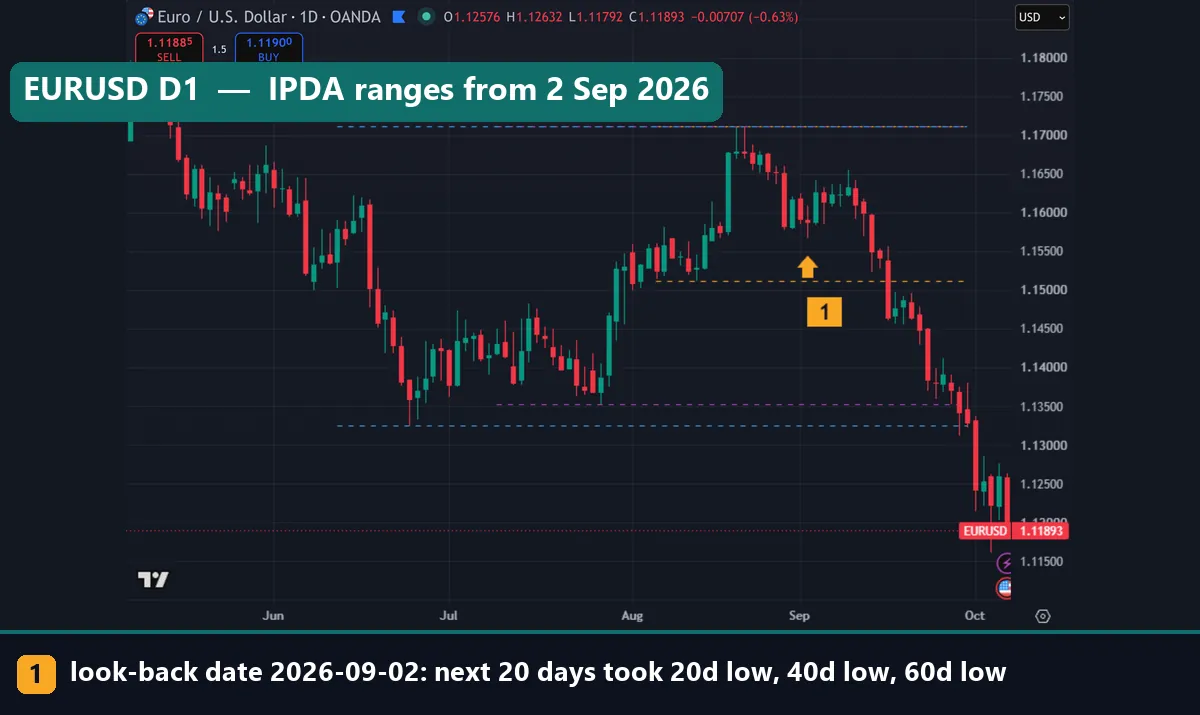
ICT uses three values of N: 20, 40 and 60. So each chart gets up to six lines. Often fewer lines show, because the same swing high can be the extreme of all three windows. For example, on our EURUSD chart one August high is the top of the 20, 40 and 60-day ranges at once.
The Donchian channel on Wikipedia describes the identical calculation. Likewise, MetaTrader 4 exposes it directly through the iHighest function in the MQL4 reference. If you prefer an indicator over hand drawing, our Donchian channel indicator plots one window at a time.
The ICT layer treats the 20-day range as the near target and the wider ranges as larger pools of resting orders. Students also hear that the ranges “refresh” every few months, which links the idea to quarterly theory. We tested only the ranges, because that is the part a chart can check.
How we tested IPDA ranges
For the count, we read daily candles for 23 FX pairs from MetaTrader 4, build 1471, with history from the Capital Point Trading terminal. The window runs from 12 June 2018 to 24 August 2026, which is 37,748 daily candles in total. Gold is not in this count.
Our rule was plain. On each daily bar, we took the highest high and lowest low of the last N days, with N set to 20, 40 and 60. Then we asked: did price trade beyond that high, or that low, within the next 20 trading days? A single tick beyond the level counted as “taken”. That gave 36,805 test days for the 20-day range, 36,345 for the 40-day range and 35,885 for the 60-day range.
For the charts, we used OANDA daily data on the TradingView web chart, captured on 7 October 2026. The symbols were EURUSD, GBPUSD, USDJPY, XAUUSD, GBPJPY and USDCHF. Every chart uses the same reference date: 2 September 2026. Our facts file also holds AUDUSD for that date, without a chart.
We measured level breaks, not trades, so every figure is before spread, swap and commission. Our full method rules are on the editorial testing policy page.
IPDA settings we used
ICT teaching leaves a few choices open. So here is every setting we fixed, side by side with the usual reading.
| Parameter | Common ICT reading | Our test value | Why it matters |
|---|---|---|---|
| Look-back windows | 20, 40, 60 trading days | 20, 40, 60 daily bars | Longer windows sit further from price |
| Forward window | 20, 40 or 60 days ahead | 20 trading days for all three | A longer forward window would raise every figure |
| Level used | Highest high, lowest low | Same, wicks included | Closing prices would give tighter ranges |
| “Taken” means | Price trades through the level | Any trade beyond it | No close required, so wicks count |
| Timeframe | Daily | Daily (D1) | Broker day boundaries shift the bars slightly |
| Universe | Any liquid market | 23 FX pairs; gold on charts only | Gold and indices were not in the count |
Two choices deserve a word. First, we held the forward window at 20 days for all three ranges. That makes the comparison fair, but it also makes the 60-day figure look smaller than a 60-day forward window would. Second, daily bars depend on where your broker starts the day, so your levels may differ by a few points from ours.
Reading the IPDA ranges on a chart
On every chart here, yellow dashed lines mark the 20-day high and low, purple the 40-day pair and blue the 60-day pair. All are fixed as of 2 September 2026. When two windows share an extreme, the lines overlap.
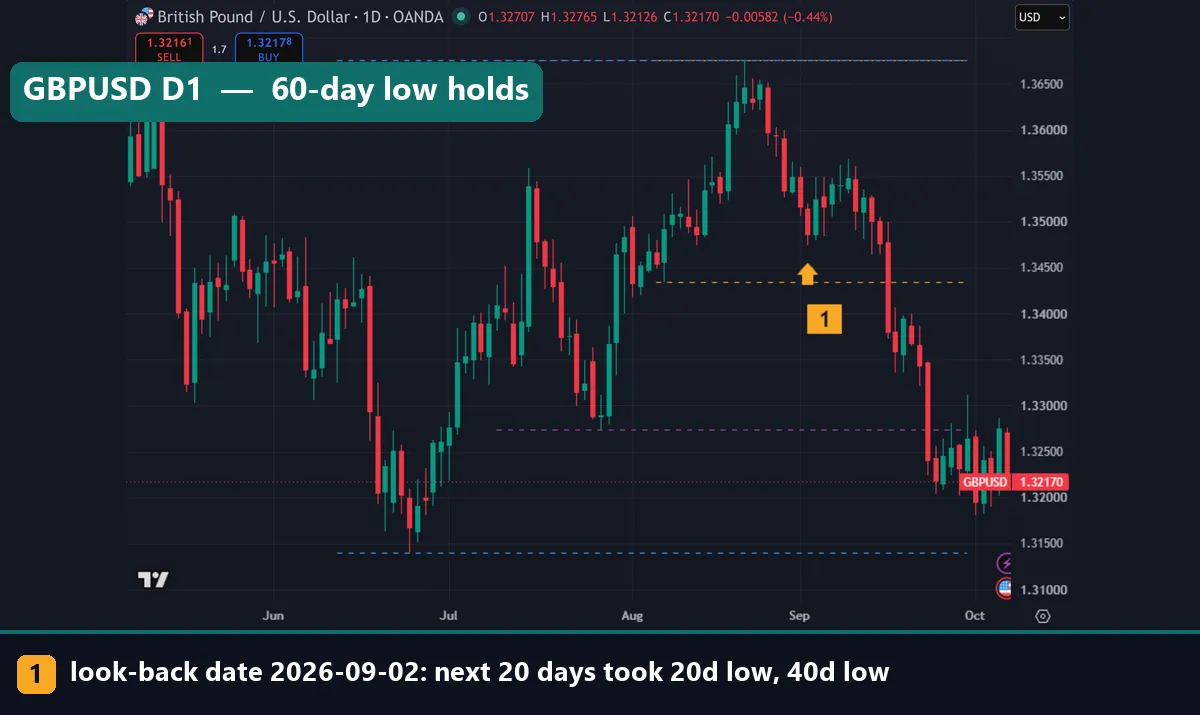
GBPUSD shows the typical layout. The 20-day range ran from 1.34344 to 1.36758. Below it sat the 40-day low at 1.32735 and the 60-day low at 1.31402. All three highs were the same August top, which price never revisited. Instead, it broke the 20-day low on 16 September and the 40-day low on 23 September. However, the 60-day low was still untouched in early October.
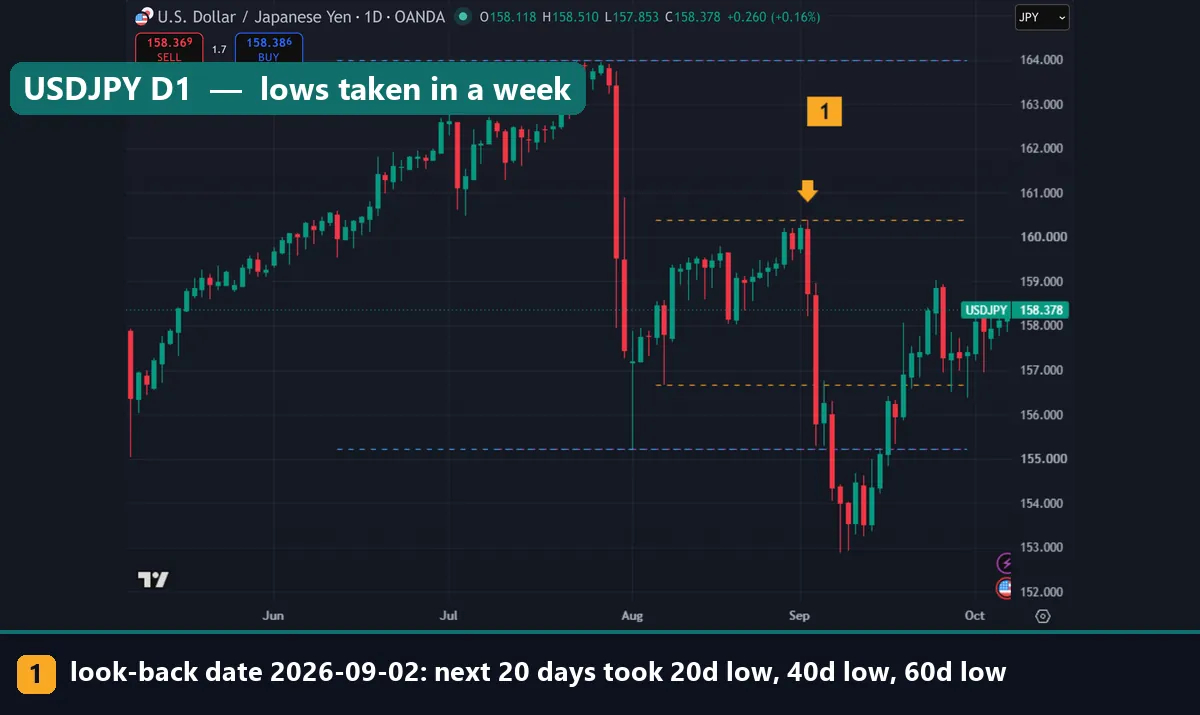
USDJPY tells a faster story. The 20-day low at 156.666 went the very next day, on 3 September. Then the 40 and 60-day low, both at 155.226, went on 7 September. The 40 and 60-day windows share both extremes here. Note that the marker box sits over the candles near the 20-day low, so read the yellow line, not the box. In both charts the near range broke first, which fits ICT’s framing and plain geometry alike.
Worked example: EURUSD from 2 September 2026
On 2 September 2026, EURUSD had a 20-day range from 1.15118 to 1.17116. That is 199.8 pips from top to bottom. The 40-day low sat lower at 1.13532, and the 60-day low at 1.13246. All three windows shared the same high, 1.17116, set in August.
So the map had four distinct levels: one shared high and three lows stepping down. The gap from the 20-day low to the 60-day low was 187.2 pips.
Here is what followed. Price broke the 20-day low on 16 September. Next, it broke both the 40-day and 60-day lows on 29 September. Meanwhile the shared high was never revisited in the forward window.
An ICT trader would read this as price “seeking” sell-side liquidity, a concept we cover in buy-side and sell-side liquidity. That reading fits afterwards. But on 2 September, nothing in the range itself said which side would go first. The direction call had to come from elsewhere, such as the ICT daily bias process or a draw on liquidity read.
Across the seven pairs in our facts file for that date, the 20-day range broke on at least one side in all seven. The 40-day range broke in six and the 60-day range in five. That is one date, so treat it as an illustration.
What 23 pairs and 36,805 days showed
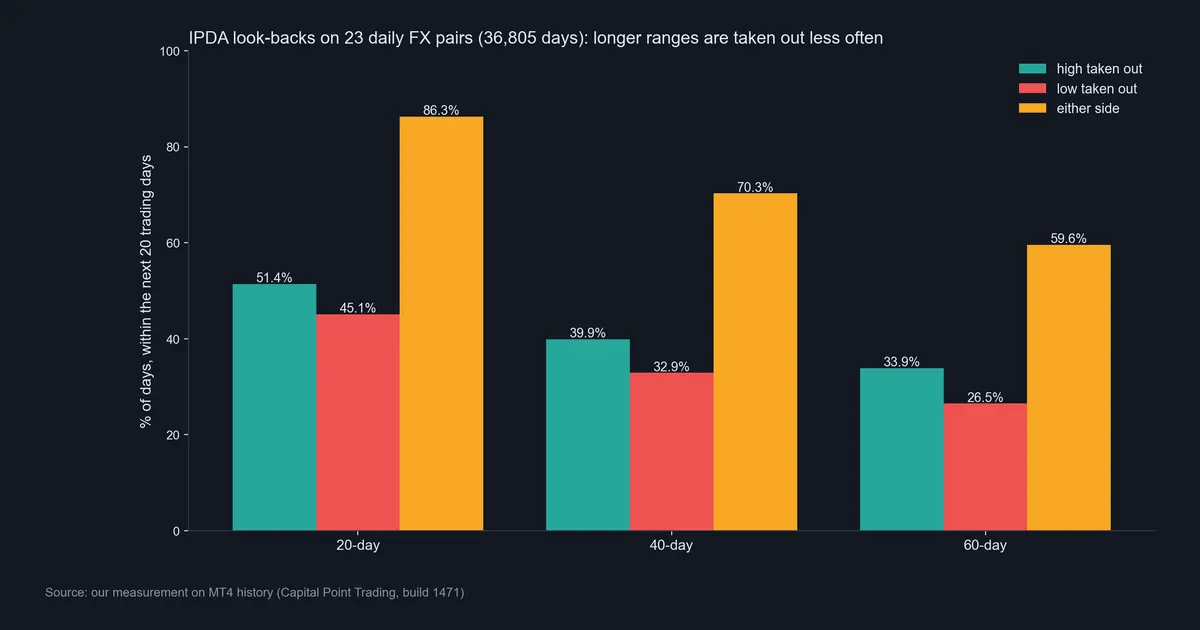
Within 20 trading days, the 20-day high was taken on 51.4% of days and the 20-day low on 45.1%. Either side went on 86.3% of days. Both sides went on 10.1%.
The numbers fall as the window widens. For the 40-day range, the high went on 39.9% of days and the low on 32.9%, with either side at 70.3%. For the 60-day range, it was 33.9% for the high, 26.5% for the low and 59.6% for either side. Both sides of the 60-day range went on just 0.8% of days.
So the 20-day range usually breaks on one side within a month, while the 60-day extremes held on about four days in ten. Also, highs went more often than lows. We did not test why; it may just reflect the trends of 2018 to 2026.
Note what the count does not show. We did not compare these rates with a random price series, so nothing here proves an algorithm. It shows how often old ranges break, which any trending, noisy market will do.
Gold: the wider lows hold
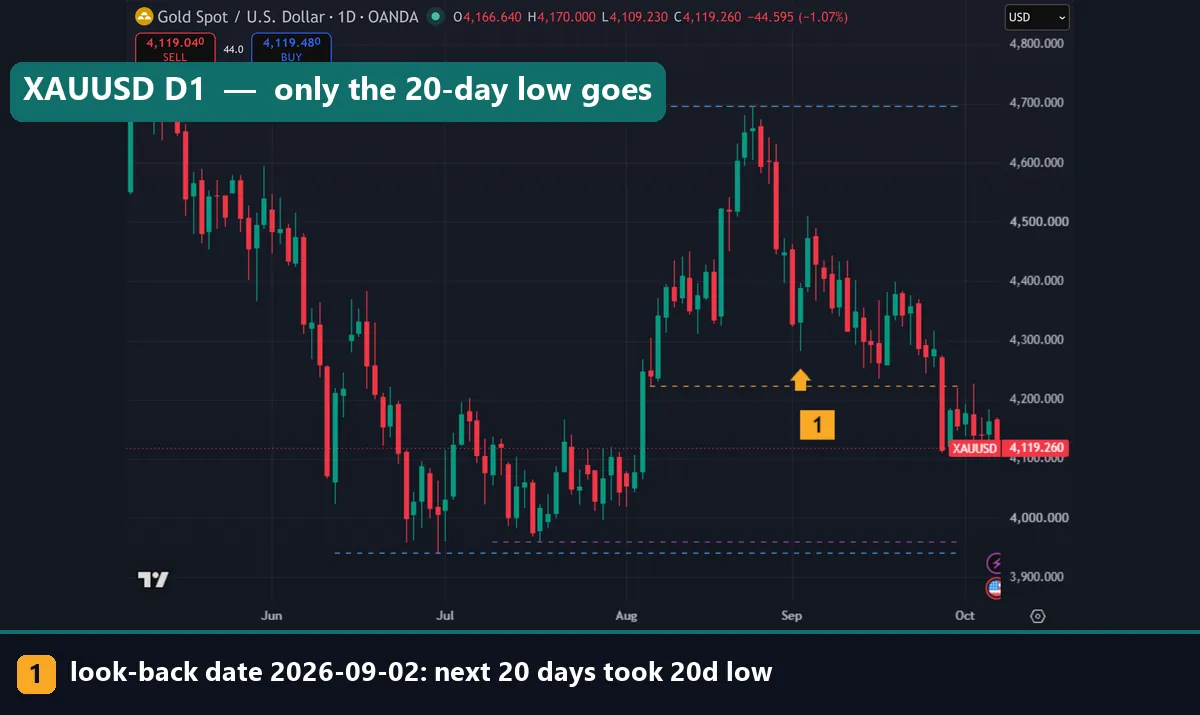
Gold shows the 60-day case. On 2 September, XAUUSD’s 20-day range ran from $4,223.505 to $4,697.105, a span of $473.60. Price took the 20-day low on 28 September. However, the 40-day low at $3,959.80 and the 60-day low at $3,942.10 both held through the forward window.
Download the complete indicator database
Put these concepts on your charts. One email unlocks the full library of 1,380+ indicators with compiled MT4 and MT5 files, plus my TradingView scripts. No paywall, no spam, unsubscribe any time.
Get free access to my indicator database
One email unlocks 1,380+ free MT4, MT5 and TradingView indicators — the complete library. No single-tool download; you get the whole database.
Where it fails
The IPDA ranges fail in four plain ways. Each one showed up in our data or charts.
- No direction. A range has two sides. The 20-day high and low were both live targets on most days. So the levels tell you where price might go, not which way.
- Breaks are common, not special. Either side of the 20-day range went on 86.3% of days. A level that breaks that often is a weak reason for a trade on its own.
- Long ranges often hold. The 60-day range had neither side taken on about 40% of days. If you wait for those levels, you can wait a long time.
- Hindsight looks perfect. After the fact, every break can be called “liquidity taken”. Before the fact, you cannot know which one will go. Our EURUSD chart reads cleanly only because we know the ending.
Our own test has limits too. It is in-sample, on one broker’s history, on daily bars only, with no gold or indices in the count. And a trading version would carry spread, swap and commission on top.
Finally, the “algorithm” claim cannot be tested from a chart. Range breaks would look the same either way. So use the ranges as reference levels and drop the story about who drives them.
Two more charts: a fast drop and a break higher
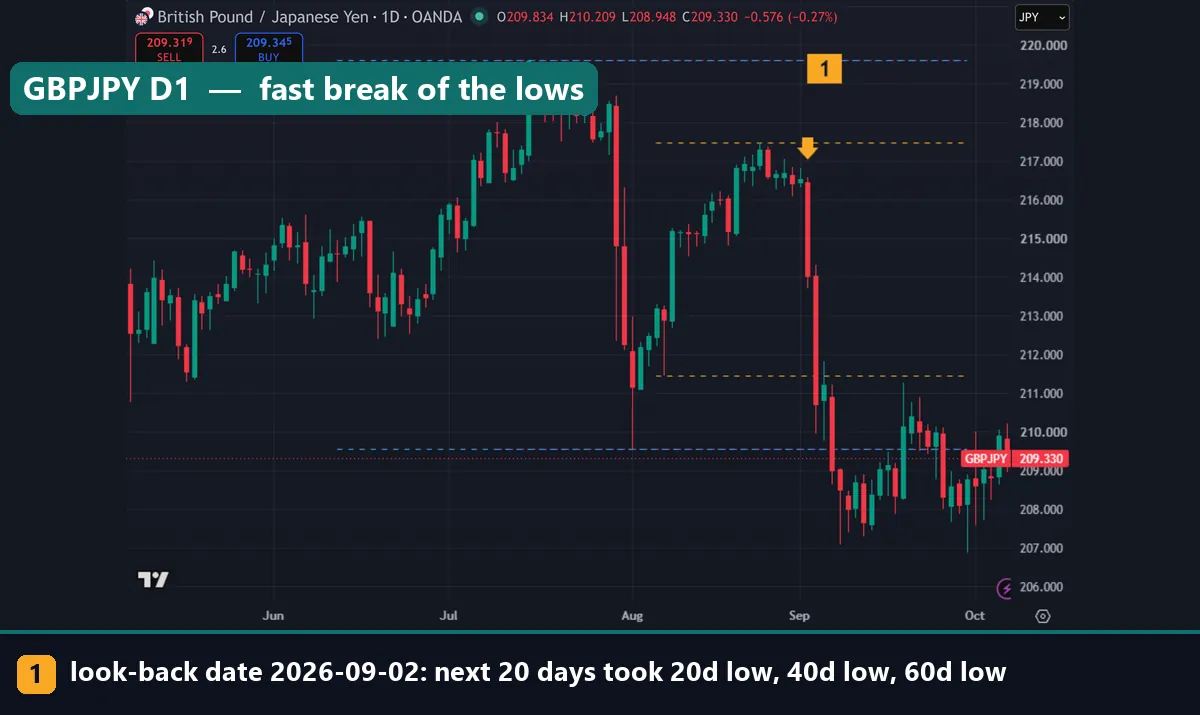
GBPJPY moved like USDJPY. The 20-day low at 211.46 broke on 3 September, the day after our reference date. Then the shared 40 and 60-day low at 209.575 went on 7 September. Again the marker box overlaps the candles, so trace the lines, not the box. The highs at 217.478 and 219.614 were never touched.
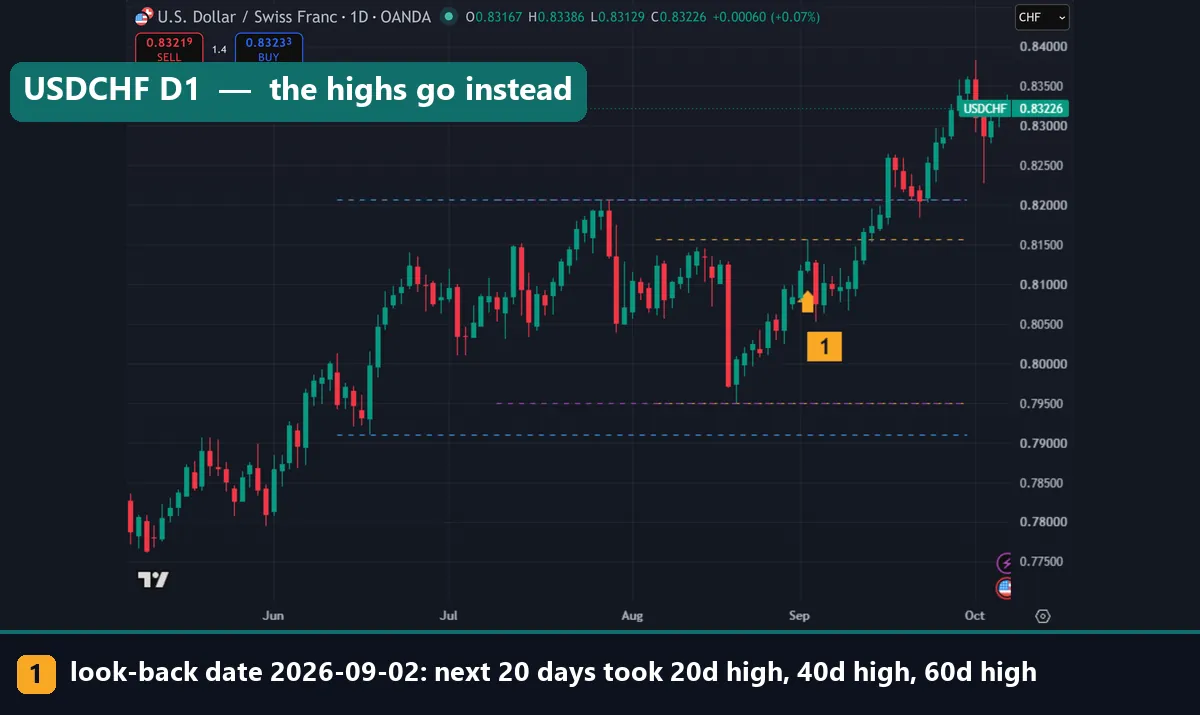
USDCHF is the counter-example: here the highs went, not the lows. The 20-day high at 0.81568 broke on 11 September. Then the shared 40 and 60-day high at 0.8207 went on 16 September. Meanwhile the lows at 0.79498 and 0.791 held. So the same date, with the same rule, produced breaks on opposite sides for different pairs.
That split is the core problem: the ranges mark levels well but say nothing about the side.
Common mistakes with IPDA ranges
We see four mistakes again and again.
- Treating the ranges as a signal. A 20-day high is a level, not an entry. Pair it with a separate bias read, such as ICT top-down analysis, or leave it alone.
- Counting days wrong. The windows are trading days, not calendar days. Twenty trading days cover roughly four calendar weeks. Using calendar days shifts every level.
- Ignoring the overlap. When the 20, 40 and 60-day highs are the same price, you have one level, not three. Our EURUSD, GBPUSD and XAUUSD charts all show a shared high.
- Stops at the obvious line. If you expect a range low to be swept, a stop just under it is the order that gets taken. Instead, size stops from volatility, as in our guide to using ATR as a stop-loss.
Where to go next
These pages carry the ideas around IPDA further:
- How to find liquidity on a chart, with the same old-high, old-low logic on lower timeframes.
- Our ICT trading strategy page, which puts these concepts into one workflow.
- The ICT dealing range, to see which IPDA levels sit inside the current range.
- Premium and discount, a common way to pick the side.
- ICT PD arrays, the zones traders watch near each level.
- SMC trading mistakes, a wider list than the four above.
For primary sources, the BIS Triennial Survey and the FX Global Code linked earlier show how the FX market is organised. Then the Donchian channel entry on Wikipedia and the iHighest page in the MQL4 reference show the range maths. Last, keep your own record: note each reference date, the six levels and what happened over the next 20 days.
FAQ: IPDA ICT questions
What does IPDA stand for in ICT?
It stands for “interbank price delivery algorithm”, a term from ICT’s teaching for the idea that price seeks old highs and lows; no such algorithm has been published or verified.
What are the IPDA data ranges?
They are the highest high and lowest low of the last 20, 40 and 60 trading days, marked on a daily chart from a chosen reference date.
How often did the 20-day range break in your test?
On 23 FX pairs from 2018 to 2026, either side of the 20-day range was taken within 20 trading days on 86.3% of days, and both sides on 10.1%.
Do the 60-day highs and lows hold more often?
Yes. Either side of the 60-day range went on 59.6% of days, so it held on both sides about four days in ten over the next 20 trading days.
Can IPDA ranges tell me which way price will go?
No. On 2 September 2026, EURUSD broke its lows while USDCHF broke its highs, so the direction call has to come from a separate bias method.
Is IPDA the same as a Donchian channel?
The calculation is the same: highest high and lowest low over N bars. The difference is the story ICT attaches to the levels, not the maths.
Which timeframe should I use for IPDA ranges?
ICT applies them to daily bars, and so did we; on lower timeframes the same logic becomes ordinary swing-high and swing-low liquidity.
Can I trade the IPDA levels on their own?
We would not, because our count measured level breaks before spread, swap and commission and found no directional edge; results are not guaranteed; past performance is not indicative of future results.
Last updated: 7 October 2026.

About the author
Written by Dominic Walsh, a Forex trader and MT4/MT5 indicator, Expert Advisor and script developer. Every tool on forexmt4systems.com is tested on live charts before release and ships with ready-to-use compiled MT4 (.ex4) and MT5 (.ex5) files. Learn more about the trader and developer behind this site.
How we build, test and correct every tool: Editorial & Testing Policy. Trading carries risk; see the disclaimer.