
A key reversal is a single bar that pushes to a fresh extreme and then closes back the other way. Many traders read it as an early sign that a trend is turning. This guide settles a simpler question: does that bar tell you anything about the next few bars? We counted 2,330 daily key reversals on 23 currency pairs and 997 hourly ones. The short answer is no, not on its own.
What a key reversal is
A key reversal is a one-bar pattern. It needs two things on the same bar. First, price makes a new extreme for the recent swing. Then the bar closes back against that push.
A bearish key reversal comes during a rise. The bar prints a higher high than any recent bar, so buyers look in control. But by the close, sellers have pushed price below the previous close. A bullish key reversal is the mirror. The bar makes a new low, yet it closes above the previous close.
The story behind it is simple. Traders who chased the breakout are now trapped on the wrong side. If they bail out, price should move further in the reversal direction. The market reversal entry on Wikipedia covers the wider idea of a trend changing direction. The key reversal is one narrow, testable slice of it.
In stock charting, the classic version also needs an opening gap beyond the prior close. Forex trades around the clock from Monday to Friday, so true gaps are rare. That is why we dropped the gap rule.
How the key reversal rule works
Any test needs a fixed rule. Ours uses a 20-bar lookback, about one trading month on a daily chart. Here is the bearish case:
high > highest(high of the previous 20 bars) AND close < previous close
And here is the bullish case:
low < lowest(low of the previous 20 bars) AND close > previous close
Note what the rule leaves out. It does not ask for a big range or a long wick. Also, the close only has to beat the prior close by any amount, even a fraction of a pip.
In TradingView’s Pine Script, the bearish test fits in one line: high > ta.highest(high, 20)[1] and close < close[1]. The Pine Script v6 reference at TradingView documents ta.highest and the history operator. In MetaTrader 4, the same lookback comes from the iHighest function in the MQL4 documentation. Start the search one bar back, so the current bar is not compared with itself.
Then we measured the outcome. “Followed” means the close N bars later sat further in the reversal direction than the signal bar’s close.
Key reversal vs outside bar vs engulfing candle
These three patterns often get mixed up.
- Key reversal: a new 20-bar extreme plus a close back past the previous close. The bar does not need to cover the prior bar’s range.
- Outside bar: the bar’s high is above the prior high and its low is below the prior low. The close can be anywhere. In The Strat’s bar numbering, this is the “3” bar.
- Engulfing candle: the body of one candle covers the body of the previous candle, in the opposite colour. Our engulfing candle guide covers the body rules.
So one bar can be all three at once, or just one of them. A key reversal is about location, a fresh extreme. An outside bar is about range. An engulfing candle is about bodies. The inside bar is the opposite of the outside bar: it fits entirely within the prior bar.
How we tested key reversals
We ran two tests on history from Capital Point Trading, MetaTrader 4 build 1471, read straight from the terminal’s history files.
- Daily test: 23 currency pairs, D1 bars from 12 June 2018 to 24 August 2026. The pairs were the majors plus crosses such as AUDCAD, EURGBP, GBPJPY and NZDJPY. This produced 1,123 bullish and 1,207 bearish key reversals.
- Hourly test: EURUSD, GBPUSD, USDJPY and XAUUSD on H1, about 15 months per symbol. This produced 453 bullish and 544 bearish key reversals.
For each daily signal we checked the close 1, 3 and 5 bars later. On H1 we checked 1, 4 and 8 bars later. Next, we compared the daily results with the base rate. That is the share of all daily bars that closed higher N days later: 51.0% after one day, 51.6% after three and 51.6% after five.
The chart examples come from the TradingView web chart with OANDA data, captured on 9 October 2026. Our editorial testing policy explains how we pick data and report results.
All results are before spread, swap and commission. They count direction only, not size. So the test tells you whether the bar points the right way more often than a coin flip, and nothing more.
The key reversal settings we used
The pattern has few moving parts. Here is each one, with the value we tested and some common alternatives.
| Parameter | Our test | Common alternatives |
|---|---|---|
| Lookback for the new extreme | 20 bars | 10 bars for faster signals, 50 bars for rarer ones |
| Close condition | Close beyond the previous close | Close beyond the previous bar’s low (bearish) or high (bullish) |
| Opening gap | Not required | Required in the stock-market version |
| Range filter | None | Bar must also be an outside bar |
| Daily outcome horizons | 1, 3 and 5 bars | 10 or 20 bars for swing trades |
| Hourly outcome horizons | 1, 4 and 8 bars | The rest of the session |
| Costs | Not included | Spread, swap and commission all reduce any edge |
The lookback matters most. A short window flags many small swings, while a long one only flags bars at the edge of a big move. We only tested 20 bars. Each stricter variant in the right column is a new rule that needs its own count.
Reading a key reversal on a chart
On a chart, look first for the extreme. The bar’s high or low should stand clear of the last month of bars. Next, check the close against the bar before it. If both boxes tick, the bar qualifies.
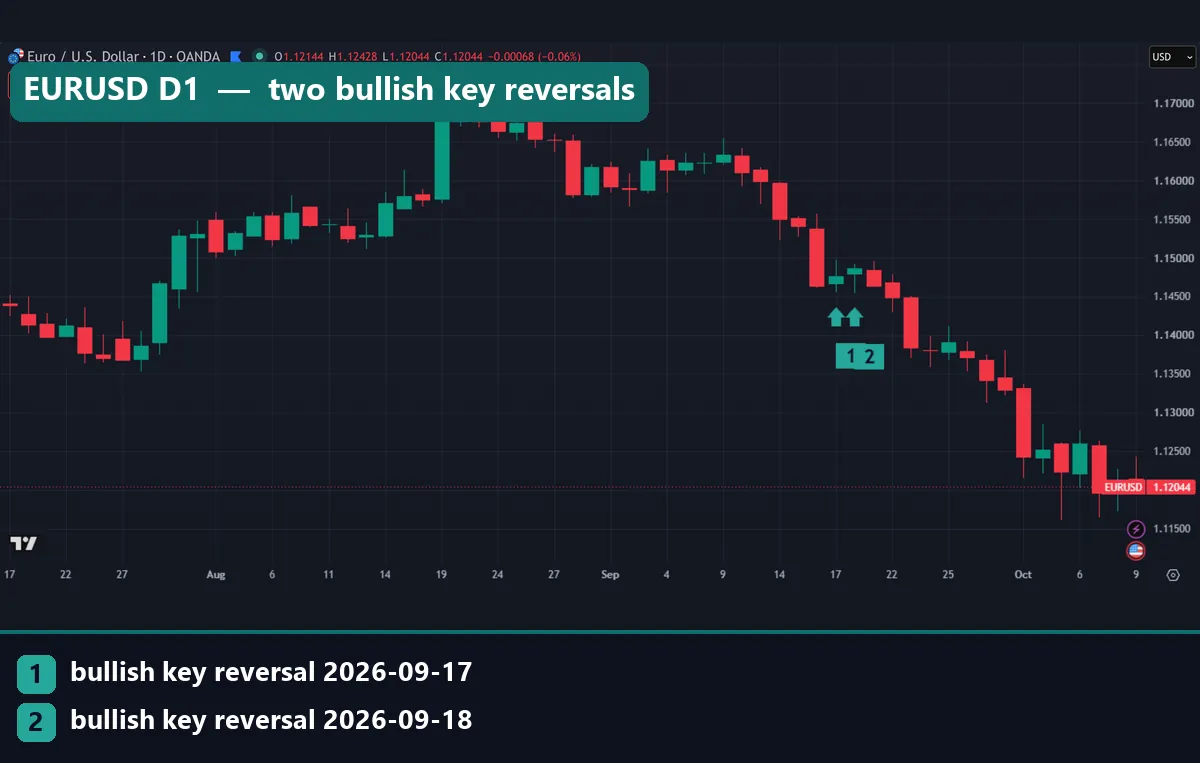
In the opening EURUSD daily chart, markers 1 and 2 sit on 17 and 18 September 2026. Both bars were bullish key reversals after a slide from the 1.16 area. The second one only qualified because its low of 1.1455 sat 1.1 pips below the first bar’s low of 1.14561. That is how loose the rule is. Price then kept falling, and the pair traded near 1.12 by early October.
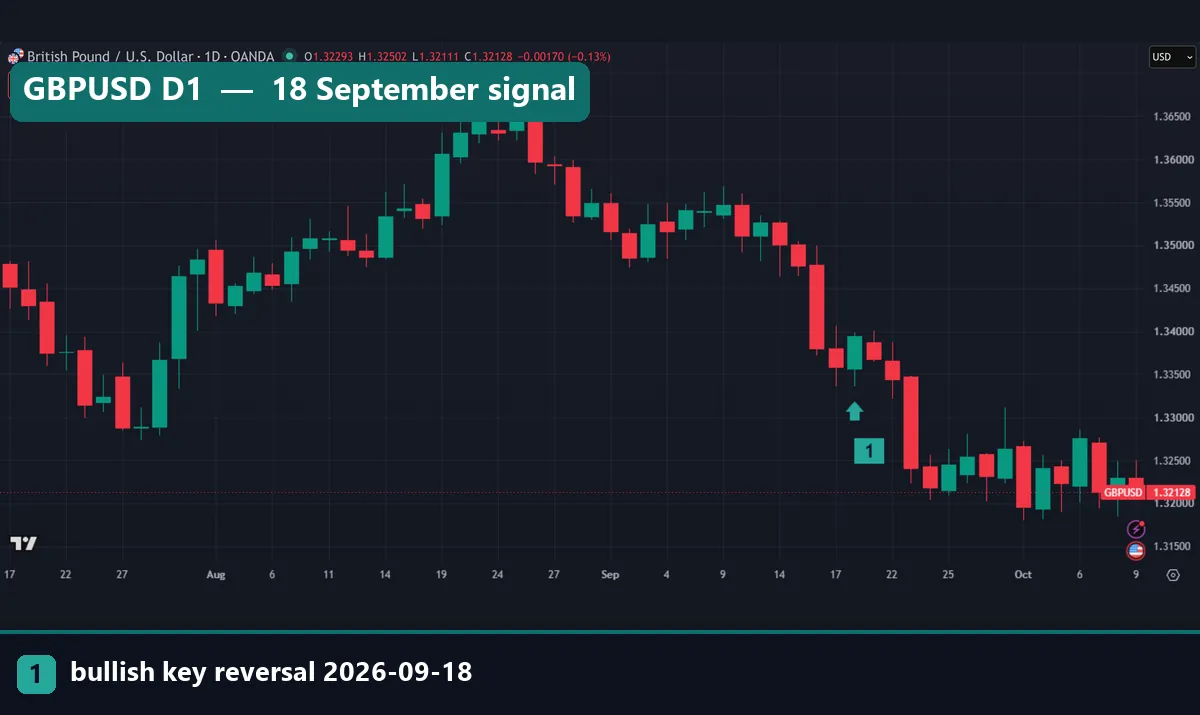
The GBPUSD daily chart shows the same date. On 18 September 2026 the bar opened at 1.33563, dipped to 1.33356 and closed at 1.33947, near its high. Yet a few days later a long red bar broke well below that low.
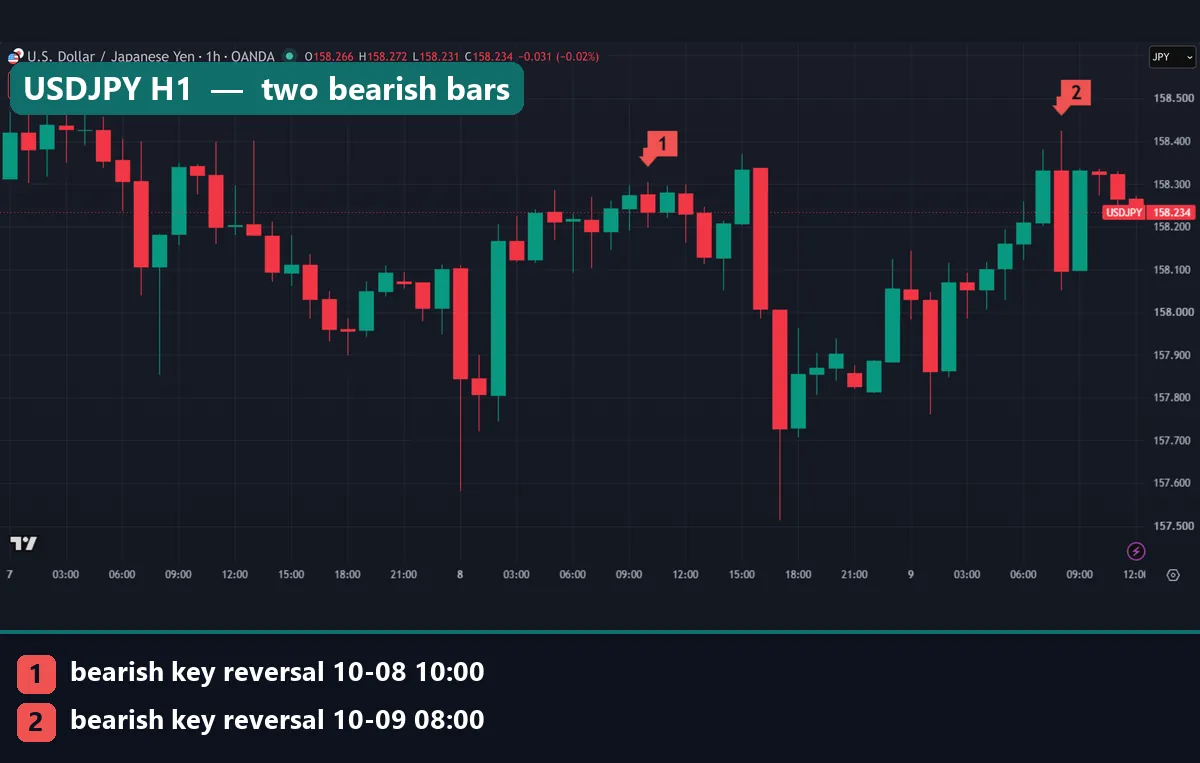
The USDJPY hourly chart has two bearish examples. Marker 1 is the 10:00 UTC bar on 8 October. Marker 2 is the 08:00 UTC bar on 9 October, which ran from 158.423 down to a close of 158.096. Price did fall later on 8 October, but only after several hours of sideways bars. After marker 2, the very next hour climbed back near the open.
Worked example: gold on 6 October 2026
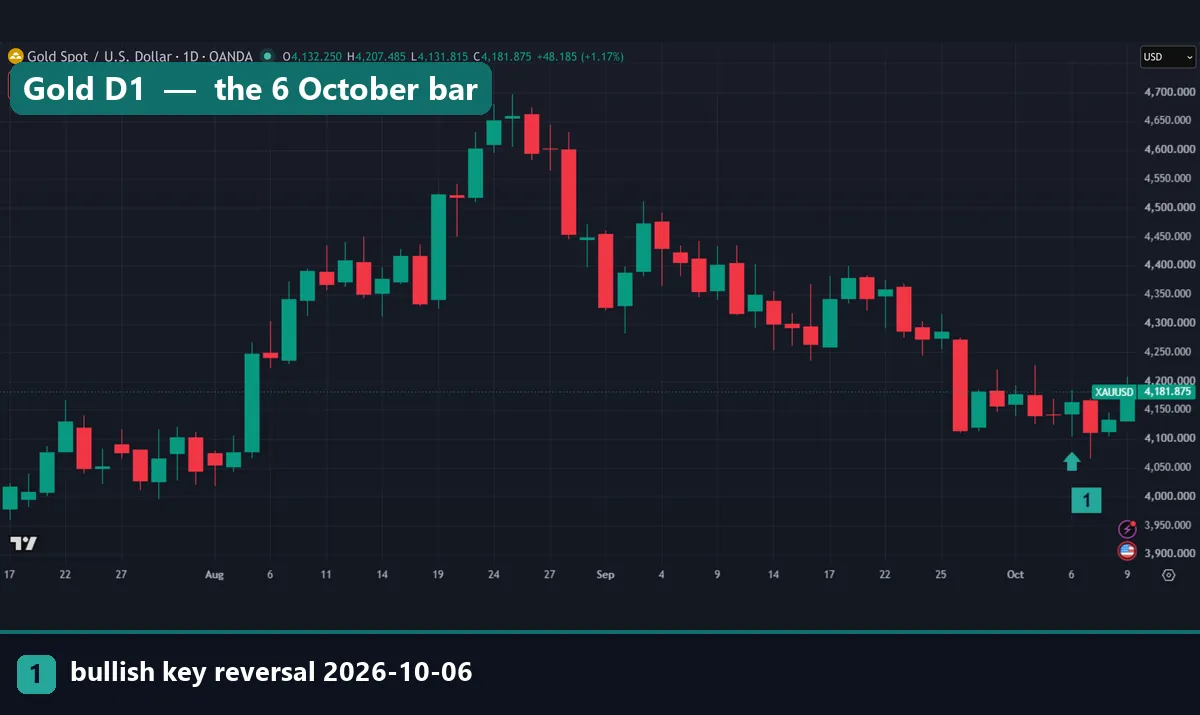
On 6 October 2026, the XAUUSD daily bar opened at $4,143.54 and fell to $4,103.515, the lowest low in 20 bars. Then it turned and closed at $4,163.855, above the previous close. So it was a bullish key reversal.
The bar’s range was $80.87, from $4,103.515 to $4,184.385. It closed $20.315 above its open, about 75% of the way up the range.
The next day tells a different story. On the chart, the 7 October candle closed lower and its wick traded below the reversal low. So a stop just under $4,103.515 would have been hit. Then gold recovered, and the 9 October bar stood at $4,181.875 when we took the capture.
There is a second twist. On H1, the hour that set that day’s high of $4,184.385 was 19:00 UTC. That same hour printed a bearish key reversal. One day, two signals in opposite directions.
What 2,330 daily key reversals did next
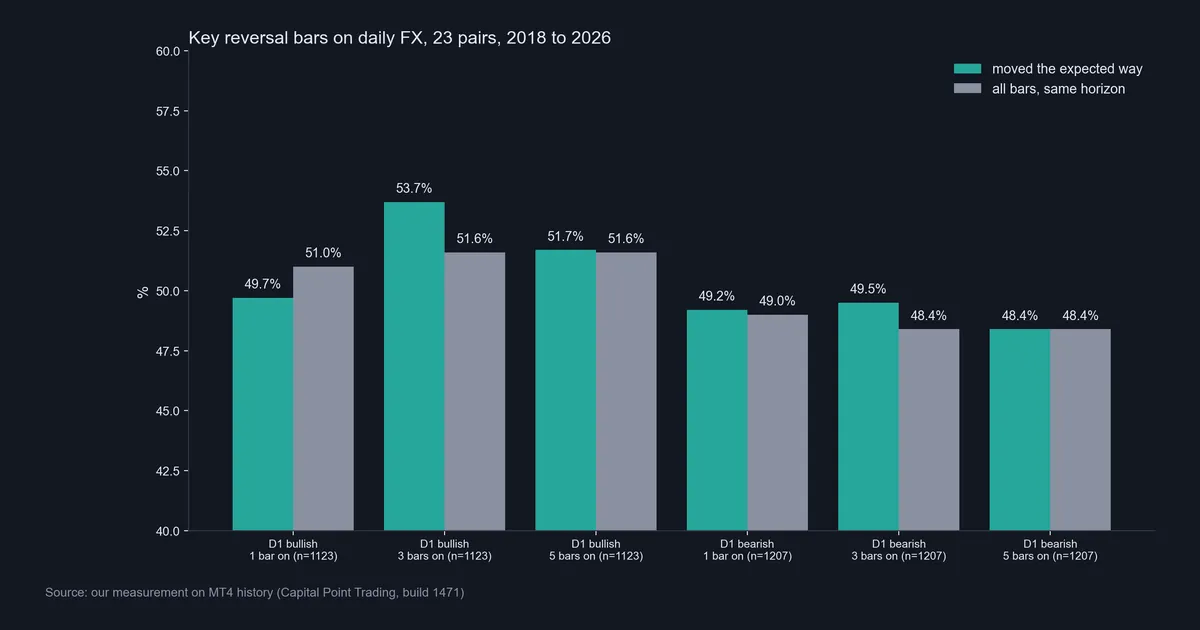
The chart above is our measurement. Teal bars are key reversals; grey bars are all bars over the same horizon.
For bullish reversals, the close one day later was higher 49.7% of the time. The base rate was 51.0%, so the pattern did slightly worse than a random day. After three days, it reached 53.7% against 51.6%. After five days, it was 51.7% against 51.6%. For bearish reversals, the figures were 49.2%, 49.5% and 48.4%. Each sat within about one point of its base rate.
The one gap worth a look is the bullish three-day figure, 2.1 points above base. But the one-day and five-day results either side of it show nothing. In short, one bump among six numbers is what noise looks like.
The hourly test gave the same picture.
| H1 signal | Count | 1 bar later | 4 bars later | 8 bars later |
|---|---|---|---|---|
| Bullish key reversal | 453 | 53.4% | 49.7% | 47.5% |
| Bearish key reversal | 544 | 52.9% | 46.5% | 50.2% |
The next hour went the expected way about 53% of the time. By four and eight hours, both sides were at or below 50%. So any short follow-through faded fast. Our note on backtest sample size explains why a few points on samples this size mean little.
Download the complete indicator database
Put these concepts on your charts. One email unlocks the full library of 1,380+ indicators with compiled MT4 and MT5 files, plus my TradingView scripts. No paywall, no spam, unsubscribe any time.
Get free access to my indicator database
One email unlocks 1,380+ free MT4, MT5 and TradingView indicators — the complete library. No single-tool download; you get the whole database.
Where it fails
The main failure is plain: on its own, a key reversal did not predict direction on daily or hourly forex in our data. Every result sat within a few points of 50% or the base rate, across more than 3,000 signals.
It also fails in strong trends. In a falling market, most new lows are 20-bar lows. So any up close on a down day becomes a “bullish key reversal”. The EURUSD pair on 17 and 18 September shows this: two signals in two days, and the slide carried on.
Next, the rule says nothing about size. A close one tenth of a pip past the prior close counts the same as a close fifty pips past it.
Timeframes clash as well. The gold example gave a bullish daily signal and a bearish hourly signal on the same day. You can always find a timeframe that agrees with you.
Finally, costs. A 53% next-bar figure on H1 is a small effect on a small move. Spread and commission can take most of it, as our guide to backtesting transaction costs explains.
Two more examples: GBPJPY and AUDUSD
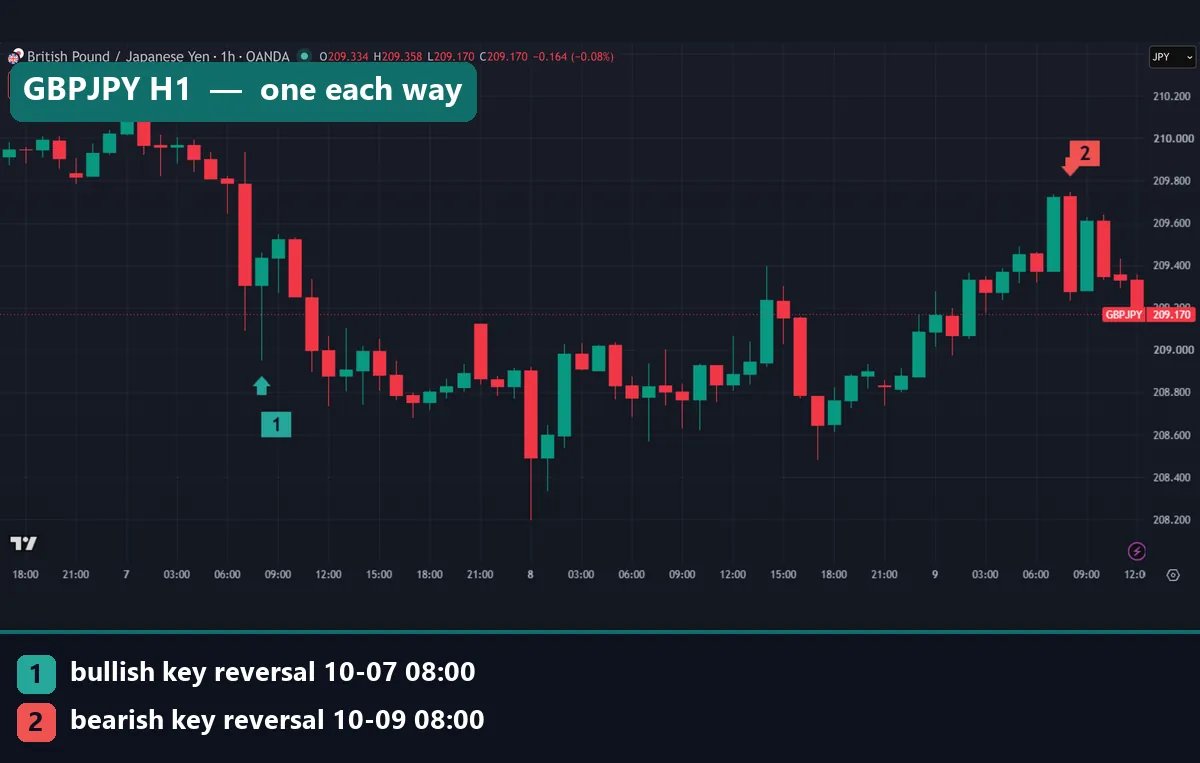
The GBPJPY hourly chart shows both sides. Marker 1, at 08:00 UTC on 7 October, closed at 209.438 after a low of 208.948. Then price drifted lower and traded below 208.4 early the next day. Marker 2, at 08:00 UTC on 9 October, is a bearish bar from 209.747 down to 209.28, and price did dip after it. So the pattern can line up with a move. It just does so about as often as not.
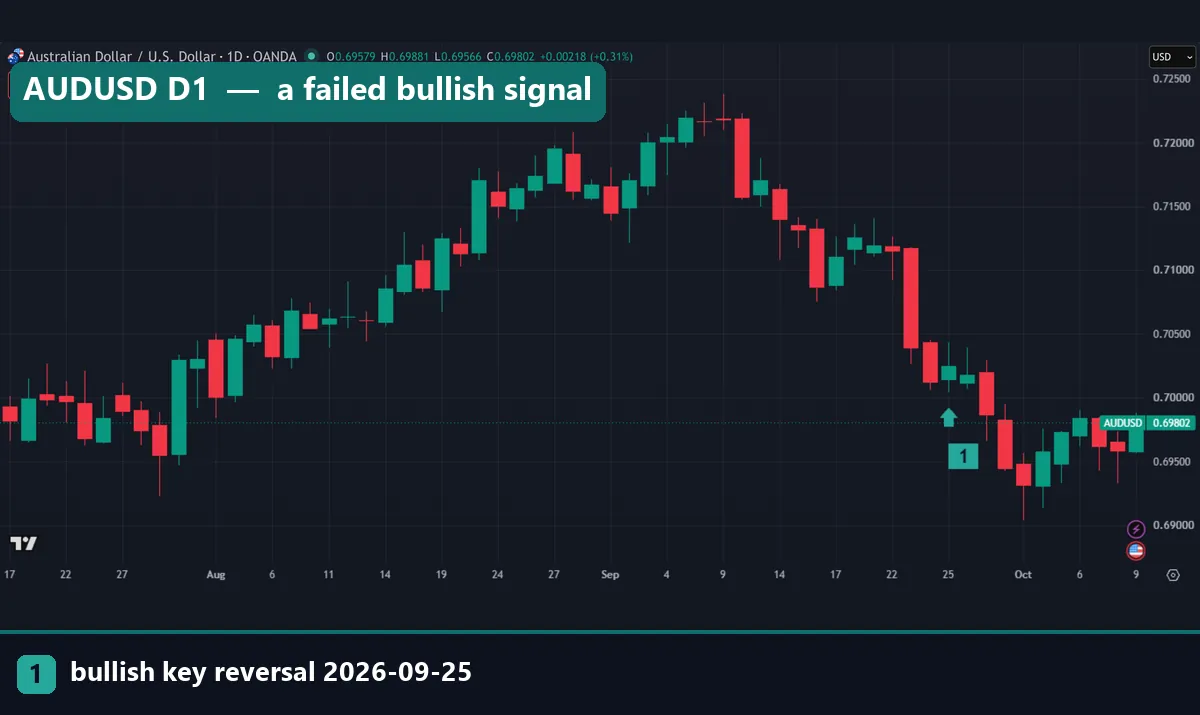
The AUDUSD daily chart is one more failed bullish case. On 25 September 2026 the bar dipped to 0.7004 and closed at 0.70244. A few days later, price fell through that low and traded near 0.69 at the start of October.
Common mistakes with key reversals
- Trading every signal in a trend. In a steady trend, the rule fires again and again against it. Our trend following guide covers why the trend deserves respect first.
- Placing the stop exactly at the extreme. The gold example broke its reversal low the next day before recovering. A stop sized from volatility, such as the method in our ATR stop-loss distance guide, at least allows for normal noise.
- Remembering the winners. A bar that marked a real top is easy to recall. Count every signal, as we did, before trusting the pattern.
- Ignoring location. A key reversal in the middle of a range means little. Some traders only look at bars that form at a level they already marked. Our guide to candlestick patterns at support and resistance explains that approach, though we did not test it here.
Where to go next
If the bar has no edge on its own, treat it as a question, not an answer. It shows that a push to a new extreme was rejected within one bar. Then look for more evidence, and define your risk first. These guides help:
- Our guide to peaks and troughs shows how to confirm a turn with structure.
- The basics of how to use a stop loss come before any entry pattern.
- The 3-bar reversal pattern on TradingView spreads the same idea over three bars.
- The pin bar focuses on the long rejection wick.
- Our test of whether candlestick patterns work covers the wider question.
- Our guide to chart pattern failure explains why reversal shapes break down.
- For marking levels first, start with support and resistance explained.
For outside reading, StockCharts ChartSchool’s candlestick chart guide explains how bars and bodies are read.
FAQ about the key reversal
What is a key reversal in trading?
It is a single bar that makes a new high or low for the recent swing and then closes back past the previous close.
Is a key reversal the same as an outside bar?
No. An outside bar covers the whole range of the bar before it, wherever it closes. A key reversal needs a fresh extreme and a close against it, but it does not have to cover the prior bar’s range.
Does a key reversal predict a trend change?
Not on its own in our data. Across 2,330 daily signals on 23 pairs, the follow-through sat within about one point of the base rate. The 997 hourly signals were close to 50% after four and eight bars.
What lookback should I use for the new high or low?
We used 20 bars, a common choice. A shorter window gives more signals at minor swings, and a longer one gives fewer at bigger turns. We only tested 20, so we cannot say whether another window does better.
Does the key reversal work better on the daily or the hourly chart?
Neither stood out. The hourly next-bar figure was about 53%, but it faded to 50% or below within four to eight hours. The daily figures stayed close to the base rate.
Why do key reversals appear so often in a trend?
In a steady fall, many bars set a new 20-bar low. So any up close on one of them qualifies as a bullish key reversal.
Can I use a key reversal with support and resistance?
Many traders do, treating the bar as a prompt to watch a level they marked earlier. We did not test that combination here, so treat it as an idea to test, not a proven setup.
Are the test results after trading costs?
No. Every figure in this guide is before spread, swap and commission, and it counts direction only. Costs would shrink any small effect further, and results are not guaranteed; past performance is not indicative of future results.
Last updated: 9 October 2026.

About the author
Written by Dominic Walsh, a Forex trader and MT4/MT5 indicator, Expert Advisor and script developer. Every tool on forexmt4systems.com is tested on live charts before release and ships with ready-to-use compiled MT4 (.ex4) and MT5 (.ex5) files. Learn more about the trader and developer behind this site.
How we build, test and correct every tool: Editorial & Testing Policy. Trading carries risk; see the disclaimer.