
The ON RRP is the Federal Reserve’s overnight reverse repo facility. Money funds and a few other big cash holders use it to lend the Fed dollars for one night. They get Treasury collateral and a set rate: 3.75% on 16 November 2026. This guide settles what the facility does and why it peaked at $2,553.7bn in December 2022. It also shows what its fall to $0.2bn means for funding rates. In short, the ON RRP shows where spare cash sits. It is not a buy or sell signal.
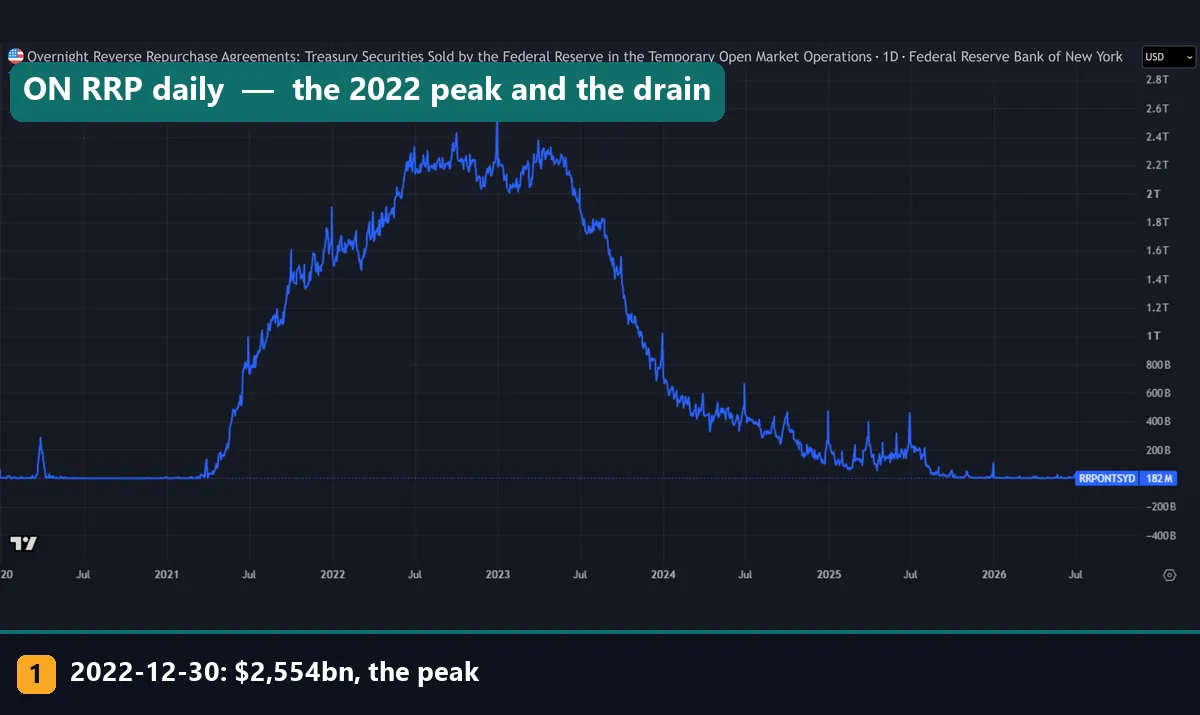
This is the daily ON RRP balance on TradingView since 2020, with marker 1 at the peak on 30 December 2022. In the 2021 climb it passed $100bn on 30 March and $1tn on 30 July. Its last day above $1tn was 29 December 2023.
What the ON RRP facility actually is
A repo is a short loan against securities. One side sells a bond and agrees to buy it back later at a slightly higher price, and that gap is the interest. In the ON RRP, the Fed sells a Treasury to a counterparty and buys it back the next business day. So the counterparty lends the Fed cash overnight.
Per the New York Fed’s reverse repo FAQ, the operation runs every business day from 12:45 to 1:15 p.m. Eastern time. Two groups can take part: primary dealers and approved RRP counterparties. That list covers 2a-7 money market funds, banks and government-sponsored enterprises. Each firm can place up to $160bn, and the FAQ lists a 3.75% offering rate.
Retail traders and hedge funds are not on the list. The main users are money funds, which cannot earn the interest the Fed pays banks on reserves. The Federal Reserve Board’s ON RRP page makes the link: the ON RRP rate does for these firms what the reserve rate does for banks.
How it works: cash, collateral and a floor rate
On the Fed’s balance sheet, an ON RRP trade swaps one liability for another. Reserves fall and reverse repos rise by the same amount, while total assets stay the same. A simple identity ties the main liabilities together:
Fed total assets = bank reserves + ON RRP + Treasury General Account (TGA)
                   + currency in circulation + other liabilities and capital
Both sides must match. So cash that leaves one line has to show up in another, or the asset side has to shrink. That is why we read the ON RRP, reserves and the TGA as one set.
The rate makes it a floor. A fund that can lend to the Fed at 3.75% has no reason to lend overnight for less. So spare cash piles in when private rates sink toward it, and leaves when dealers pay more. The FOMC sets the rate and can change it at any FOMC meeting. One line of arithmetic measures the gap:
gap (bp) = (SOFR - ON RRP award rate) x 100
13 November 2026: (3.90 - 3.75) x 100 = 15 bp
How we tested
We pulled seven FRED series on the TradingView web chart on 16 and 17 November 2026, as daily and weekly bars. We dropped bars dated 17 November, which were still forming, and turned every dollar amount into billions. Our guide to using the TradingView chart shows how to load a FRED symbol.
FRED:RRPONTSYD, the daily balance, runs from 7 February 2003 to 16 November 2026. But daily rows only start on 23 September 2013; before that it has 92 scattered prints. The weekly series for reserves, the TGA and Fed assets run from 16 December 2002 to the week of 9 November 2026. Rates come from FRED:RRPONTSYAWARD, FRED:SOFR and FRED:IORB.
We found the days the balance crossed $100bn and $1tn, and counted days above $2tn and under $10bn. We also measured the last-day change at 55 quarter ends. Then we took the median gap between SOFR and the award rate for each year. We tested no trading rule. Our editorial testing policy explains how we collect and check figures like these.
The facility’s terms and the series we pulled
Here are the operating terms from the New York Fed, then the series behind every number in this guide.
| Term | Setting (New York Fed FAQ) |
|---|---|
| Schedule | Every business day, 12:45 to 1:15 p.m. ET |
| Length | Overnight, unwound the next business day |
| Offering rate | 3.75% |
| Limit per counterparty | $160bn |
| Who can bid | Primary dealers, 2a-7 money market funds, banks, GSEs |
| Collateral | US Treasury securities |
| Bid size | $1m minimum, in $1m steps |
| Symbol | What it holds | Bars | Latest value |
|---|---|---|---|
| FRED:RRPONTSYD | ON RRP balance | Daily | $0.2bn (16 Nov 2026) |
| FRED:RRPONTSYAWARD | ON RRP award rate | Daily | 3.75% (16 Nov) |
| FRED:IORB | Interest on reserve balances | Daily | 3.90% (16 Nov) |
| FRED:SOFR | Secured Overnight Financing Rate | Daily | 3.90% (13 Nov) |
| FRED:WRESBAL | Bank reserves, week average | Weekly | $2,960.6bn |
| FRED:WTREGEN | Treasury General Account, week average | Weekly | $914.4bn |
| FRED:WALCL | Fed total assets | Weekly | $6,758.9bn |
Weekly values are for the week of 9 November 2026.
Reading the ON RRP chart near zero
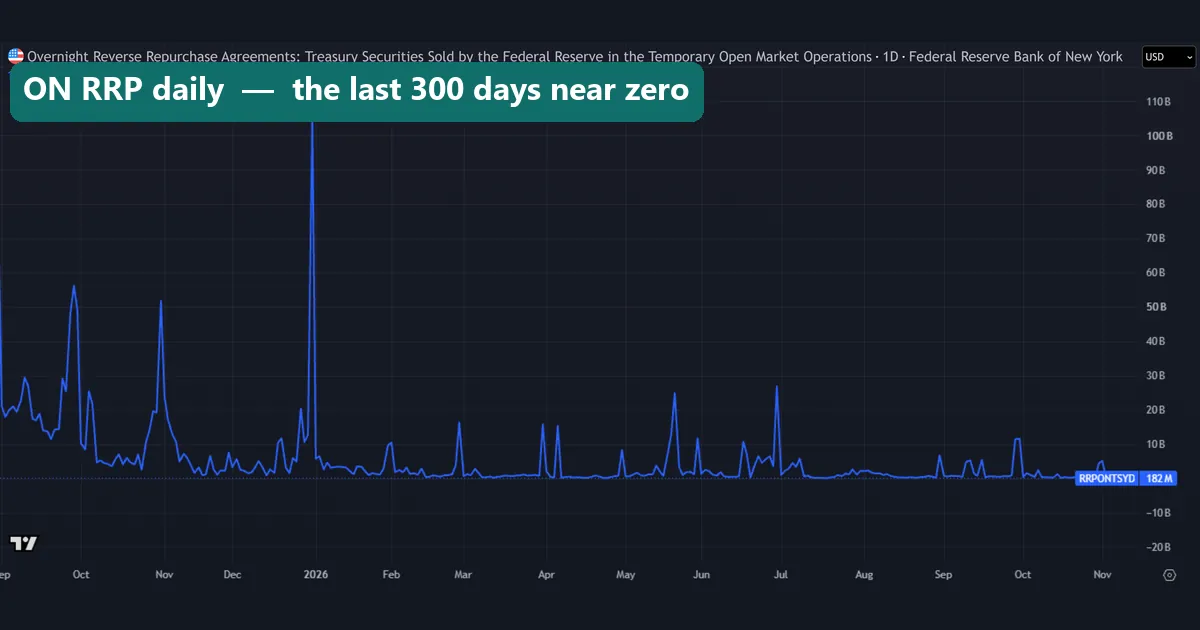
This chart covers about the last 300 trading days, to 16 November 2026. Check the scale first: the axis tops out near $110bn, not $2.8tn. The tall spike is 31 December 2025, at $106.0bn. It sits between $12.6bn the day before and $5.7bn on 2 January 2026.
Smaller spikes mark other month and quarter ends, and each fades within days. Since January 2025 the balance closed under $10bn on 53.7% of days, and on 20 July 2026 it rounded to zero. The last print is $0.2bn. TradingView shows it as 182 M because it keeps the series in dollars.
The balance first dipped under $100bn on 20 December 2024, at $98.4bn, then bounced. Since 4 August 2025 it has closed above $100bn only once, on that year-end day. So read this chart for spikes, not trend.
Reading bank reserves next to it
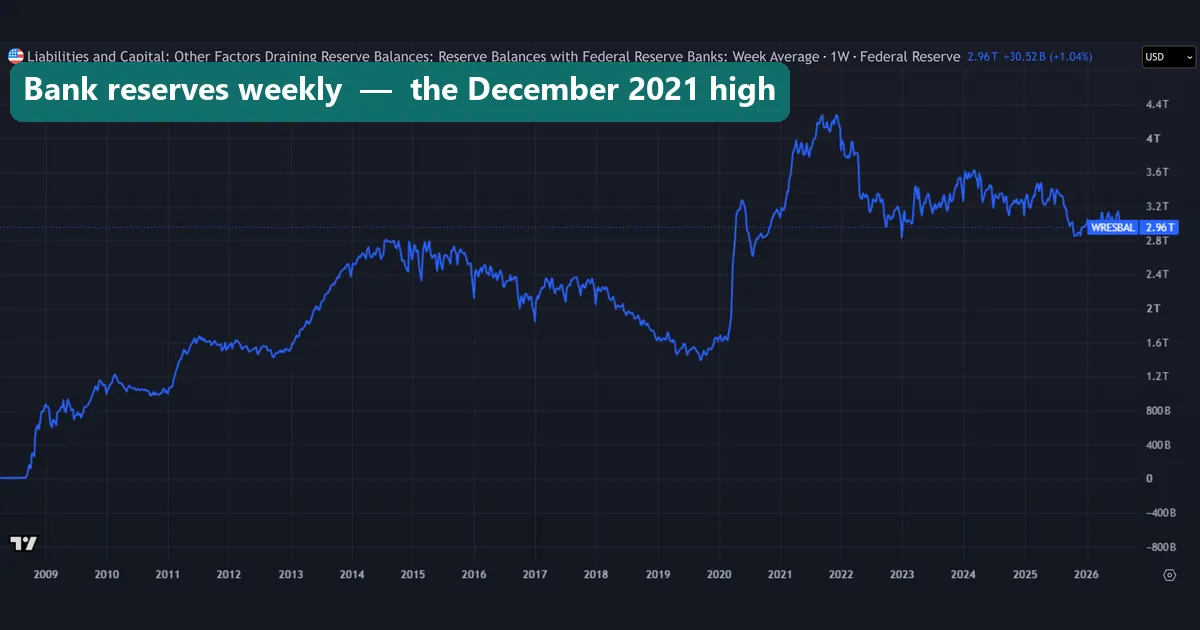
Reserves are the cash banks hold in their accounts at the Fed. FRED:WRESBAL is a weekly average, shown here from 2008. In March 2006 reserves stood at just $2.8bn. They rose in big steps after 2008, slid in 2018 and 2019, and jumped in 2020. Then they peaked at $4,275.8bn in the week of 6 December 2021. The latest week reads $2,960.6bn.
After its peak the ON RRP drained by about $2.55tn. Yet on this chart reserves held mostly between $2.8tn and $3.6tn from 2023 to 2026. So the first wave of draining came out of the reverse repo line, not out of bank accounts. In effect, the ON RRP worked as a buffer.
Worked example: the quarter-end spike
Quarter ends are the clearest pattern on an ON RRP chart, and the record itself is one. Here is the peak, day by day:
- 29 December 2022: $2,308.3bn.
- 30 December 2022, the last day of the year: $2,553.7bn, the all-time high, up $245.4bn in one day.
- 3 January 2023, the next business day: $2,188.3bn, below where the run started.
So the record was a one-day year-end bump on a high base. Year-end 2025 had the same shape on a far smaller base. The balance read $12.6bn on 30 December, $106.0bn on 31 December and $5.7bn on 2 January 2026. That $93.4bn jump vanished a day later.
Across all 55 quarter ends in our data, the median last-day jump was +$99.6bn. In 2026 the jumps shrank to +$15.0bn in March, +$23.4bn in June and +$0.1bn in September. The usual explanation is window dressing: some dealers borrow less over a reporting date, so funds park cash at the Fed for a night. Our data shows the pattern, not the cause. So compare a quarter-end print with the days on both sides.
The ON RRP, reserves and the Treasury account together
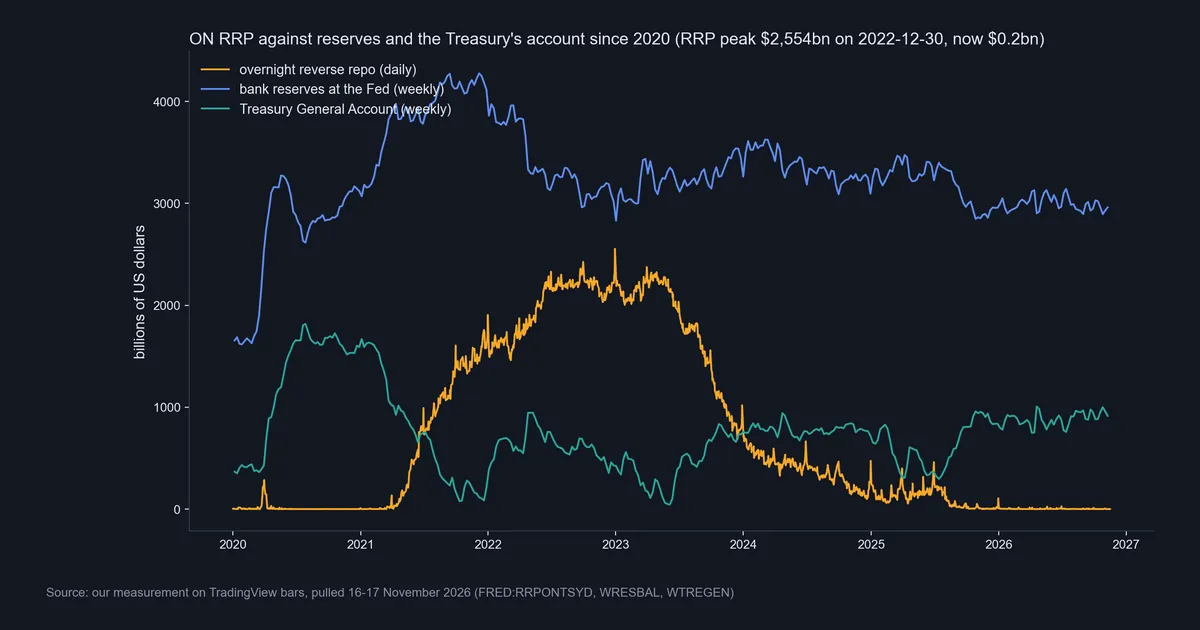
This chart puts the three lines on one scale since 2020. Its title gives the peak, $2,554bn on 2022-12-30, and the latest $0.2bn. The orange RRP line rises in 2021 as the teal TGA line falls. Then from mid-2023 the RRP drops while the TGA climbs back.
Now a second worked example, with weekly numbers. Fed total assets peaked at $8,965.5bn in the week of 11 April 2022. In the week of 9 November 2026 they stood at $6,758.9bn, which is $2,206.6bn less. Over its own run the ON RRP fell from $2,553.7bn to $0.2bn, a drop of $2,553.5bn. Meanwhile the TGA ended at $914.4bn, far above its 2022 and 2023 lows.
The dates differ and other lines move too, so the sums will not match. Still, the order is plain. After the 2022 peak, the RRP gave up cash first. Reserves only began to slide in the second half of 2025, once it was nearly empty.
The floor: SOFR against the ON RRP rate
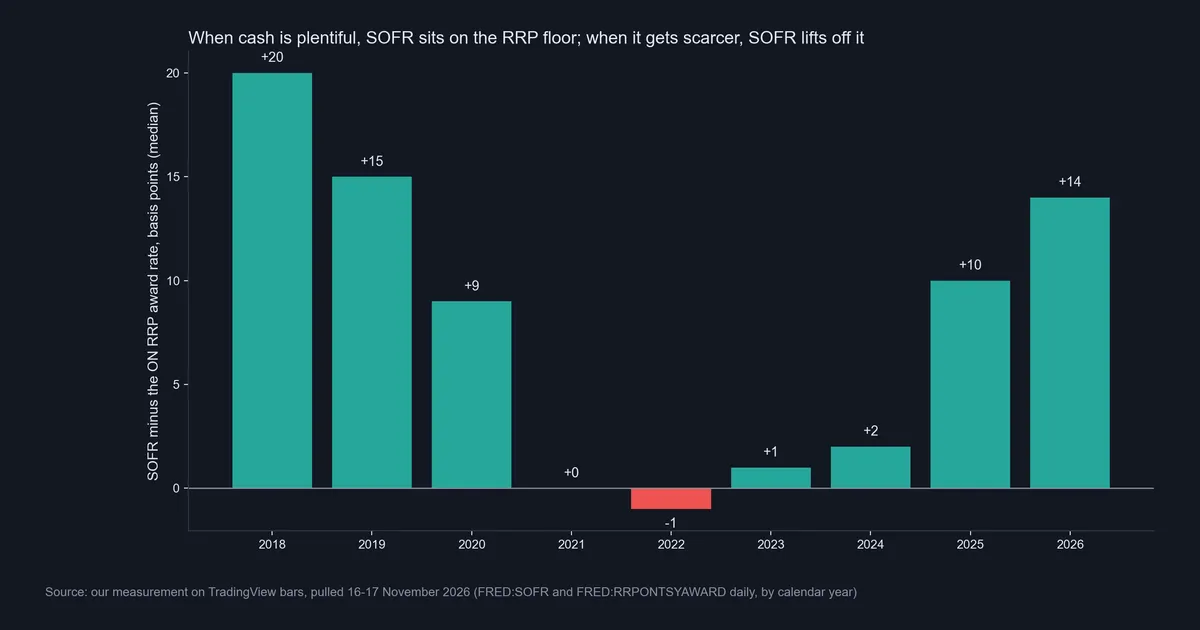
SOFR, the Secured Overnight Financing Rate, tracks what overnight repo against Treasuries costs. When cash is plentiful, lenders compete and SOFR sinks to the RRP rate. When cash gets scarcer, borrowers bid more and SOFR lifts off the floor.
Our median gap by year was +20 bp in 2018, +15 in 2019 and +9 in 2020. It sat at 0 in 2021 and -1 in 2022, while the facility held trillions. Then came +1 in 2023, +2 in 2024, +10 in 2025 and +14 in 2026. SOFR can slip under the floor because not every lender can use the facility.
On 13 November 2026, SOFR was 3.90% against a 3.75% award rate. On 16 November, IORB, the rate the Fed pays on bank reserves, was also 3.90%. So overnight repo now prices at the reserve rate, not at the floor. Our guide on how interest rates affect forex shows how such rates reach currencies.
Download the complete indicator database
Put these concepts on your charts. One email unlocks the full library of 1,380+ indicators with compiled MT4 and MT5 files, plus my TradingView scripts. No paywall, no spam, unsubscribe any time.
Get free access to my indicator database
One email unlocks 1,380+ free MT4, MT5 and TradingView indicators — the complete library. No single-tool download; you get the whole database.
Where it fails
It is not a price signal. We tested no rule linking the ON RRP to stocks, bonds or the dollar. Also, liquidity here means funding cash, not the order-book depth in our guide to liquidity in trading.
Quarter ends distort it. On 31 December 2024 it read $473.5bn, after $260.7bn the day before, and it fell back the next business day.
Near zero, it goes quiet. A line on the floor cannot show more draining. So the signal has moved to SOFR, IORB and reserves.
Units trip people up. TradingView shows dollars, so 182 M means $0.2bn. Our figures round to $0.1bn, and a $0.0bn day does not prove that nobody took part.
Weekly and daily series mix badly. WRESBAL and WTREGEN are week averages, while RRPONTSYD is a daily print.
The rate is a policy choice. The FOMC can change the offering rate or the terms at any meeting. Our guide to central bank rate decisions covers how such changes arrive.
Who used it shows up late. The New York Fed adds the split by counterparty type with a one-month lag. So today’s total cannot tell you which firms left.
Two more charts: the Treasury’s account and the daily gap
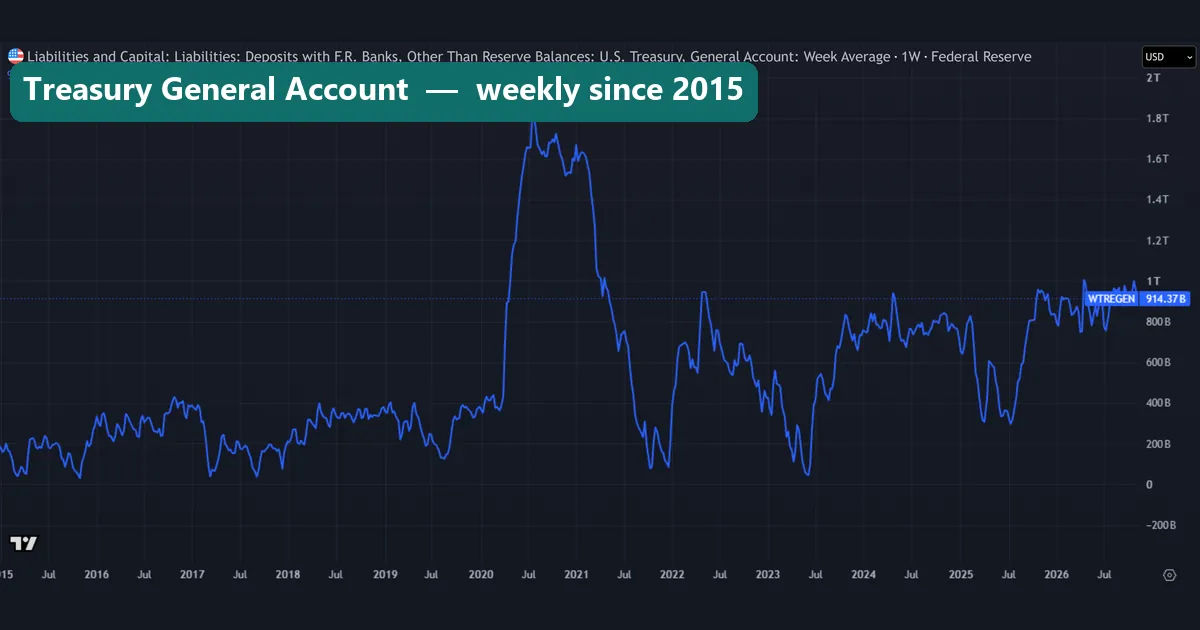
The Treasury General Account is the government’s cash account at the Fed. Tax receipts and bill sales build it up. Then cash leaves banks and money funds, so reserves or the ON RRP fall by the same amount, all else equal. On this weekly chart the TGA spiked to about $1.8tn in mid-2020. It sank below $100bn around the turn of 2022 and in mid-2023, and it reads $914.4bn now. The Daily Treasury Statement on Treasury Fiscal Data gives the daily balance.
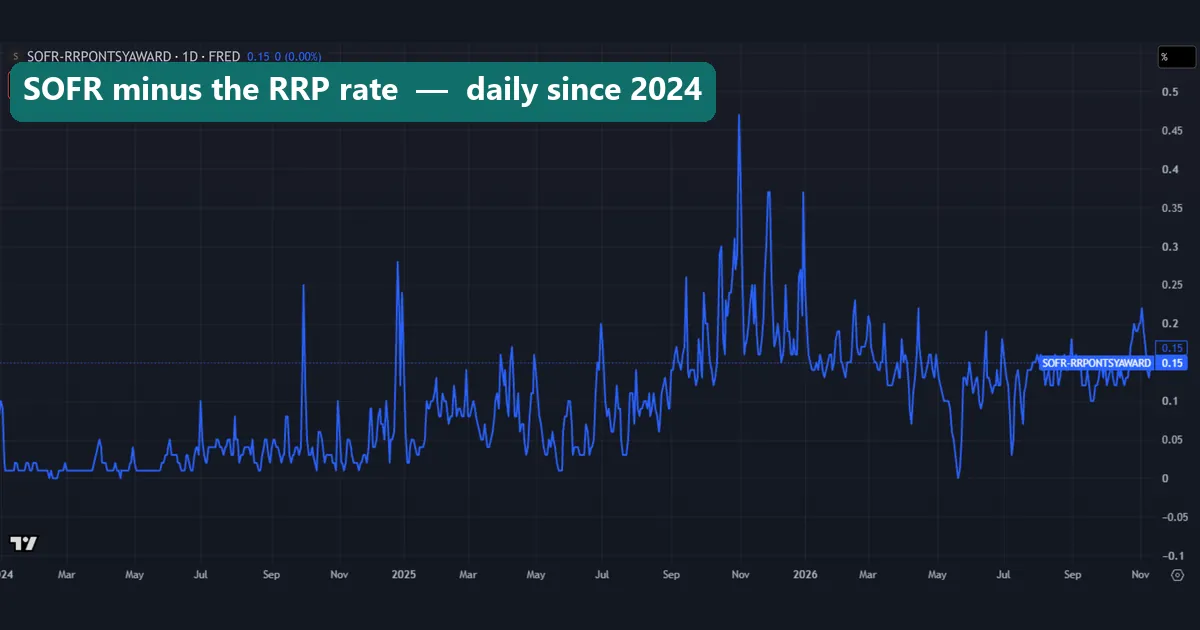
This chart plots SOFR minus the award rate each day since early 2024, in percentage points: 0.15 means 15 bp. Through most of 2024 it hugs 0.01 to 0.05. It lifts in autumn 2025, and its highest print, a little above 0.45, came around the end of October. Since early 2026 it has mostly held between 0.10 and 0.20. Ignore the SELL and BUY boxes in the corner: that is TradingView’s trading panel, not a market in this gap.
Common mistakes
1. Treating the balance as money waiting to buy stocks. The cash belongs to funds that may only hold short, high-grade paper. When it leaves, it moves into similar paper, such as Treasury bills or private repo. Our guide to what yields are covers how bill and bond yields work.
2. Reading a quarter-end spike as a trend. Year-end 2025 added $93.4bn in a day and gave it all back by 2 January 2026.
3. Ignoring the Treasury’s account. A rising TGA can drain reserves even while the ON RRP sits flat near zero. Read the three lines together.
4. Mixing up repo and reverse repo. In a Fed repo, the Fed lends cash to dealers. In the ON RRP, it borrows cash from funds. Headlines about the Fed adding money through repo describe the opposite trade.
Where to go next
Pair the ON RRP with the policy side. Start with how to read the Fed dot plot and hawkish versus dovish central banks. For the money side, read what M2 money supply measures. Then see how rate gaps reach currencies in bond yields and forex and the dollar index in forex.
Our guide to JOLTS job openings reads FRED data on TradingView the same way. To find FOMC days, see how to read an economic calendar. Outside our site, the OFR’s Short-term Funding Monitor charts repo volumes and rates.
FAQ: the ON RRP
What does ON RRP stand for?
Overnight reverse repurchase agreement. The Fed sells a Treasury to an approved firm and buys it back the next business day, so in effect it borrows that firm’s cash for one night.
Who can use the ON RRP facility?
Primary dealers and the New York Fed’s approved counterparties, which include 2a-7 money market funds, banks and government-sponsored enterprises. Individual traders and hedge funds cannot.
Why did the ON RRP go above $2.5 trillion?
Private repo paid no more than the Fed’s floor: our median SOFR gap was 0 bp in 2021 and -1 bp in 2022. So funds parked cash at the Fed. It peaked at $2,553.7bn and closed above $2tn on 263 days.
Why is the ON RRP near zero now?
Private borrowers pay more than the floor, with a median gap of +14 bp in 2026. Fed assets also sit $2,206.6bn below their 2022 peak, and the Treasury’s account holds $914.4bn.
What rate does the ON RRP pay?
The FOMC sets it. On 16 November 2026 the award rate was 3.75%, below the 3.90% paid on bank reserves that day. The New York Fed posts it with each day’s results.
Does the ON RRP move the dollar or the stock market?
We did not test that, so we make no claim. The balance shows where spare cash sits, and the SOFR gap shows how tight funding is.
Where can I find ON RRP data?
FRED carries the balance as RRPONTSYD and the rate as RRPONTSYAWARD. TradingView shows both with a FRED: prefix, and the New York Fed posts results after each operation.
Is a near-zero ON RRP a warning sign?
Not by itself. It means private repo pays more than the Fed’s floor, so reserves take the next drain. Watch SOFR against IORB and the weekly reserves line for strain. As with any reading of market data, results are not guaranteed; past performance is not indicative of future results.
Last updated: 17 November 2026.

About the author
Written by Dominic Walsh, a Forex trader and MT4/MT5 indicator, Expert Advisor and script developer. Every tool on forexmt4systems.com is tested on live charts before release and ships with ready-to-use compiled MT4 (.ex4) and MT5 (.ex5) files. Learn more about the trader and developer behind this site.
How we build, test and correct every tool: Editorial & Testing Policy. Trading carries risk; see the disclaimer.