
The relative volatility index is an RSI-style oscillator that asks a different question: on which days was volatility bigger, the up days or the down days? This guide settles what the line measures, how Donald Dorsey built it, what the TradingView defaults mean, and whether its 50-line crosses helped on 23 currency pairs. Our short answer: the crosses carried no edge over the base rate. Still, the line has a use, and we show it.
What the relative volatility index is
Donald Dorsey introduced the relative volatility index in 1993, in Technical Analysis of Stocks & Commodities magazine. He took the frame of Welles Wilder’s RSI and swapped the input. The RSI averages the size of price changes. The RVI, by contrast, averages the standard deviation of closes, split by the direction of each day.
So the line answers one plain question. Over the recent past, did volatility show up more on rising days or on falling days? A reading above 50 says up days carried more of it. A reading below 50 says down days did.
Dorsey did not design it as a stand-alone signal. He meant it as a confirming filter for other tools, such as a moving average cross. In short, you take long signals only when the RVI is above 50, and short signals only when it is below 50. We tested that 50 line directly, and the results come later.
The output runs from 0 to 100, like the RSI. On TradingView the pane legend reads “RVI 10”, with dashed lines at 80 and 20, not at 50.
Not the relative vigor index: which RVI is which
Two different indicators share the letters RVI, and that causes real mistakes. The relative vigor index compares the close with the open, inside each bar’s range. It has a signal line and swings around zero. The relative volatility index has no signal line and lives between 0 and 100.
The platform labels make it worse. In MetaTrader 4 and MetaTrader 5, the built-in indicator called “RVI” is the vigor index. MetaTrader does not ship the volatility index at all. On TradingView, however, the volatility index shows “RVI” in its legend, while the vigor index shows “RVGI”.
So check the scale first. One line from 0 to 100 is the volatility index. Two lines around zero is the vigor index.
How the relative volatility index is calculated
The math has three steps. First, measure volatility. Then sort it by day type. Finally, smooth each side and compare them.
SD(t)   = standard deviation of the last 10 closes
Up(t)   = SD(t) if close(t) > close(t-1), else 0
Down(t) = SD(t) if close(t) < close(t-1), else 0
U = 14-bar EMA of Up
D = 14-bar EMA of Down
RVI = 100 x U / (U + D)
The first step uses the same standard deviation formula in the MetaTrader 4 help. Next, each bar files that number under “up” or “down”, based only on its close versus the bar before. Then two EMAs smooth each pile.
Here is the key detail. The size of today’s move does not matter, only its direction. A tiny up day in a wild market adds a large number to the up side. That is why the RVI can look jumpy even when price barely moves.
Dorsey modelled the smoothing on Wilder’s RSI, and ports differ on the exact average. TradingView and our test both use a 14-bar EMA. Dorsey also published a refined version that averages one RVI built on highs with one built on lows. The TradingView built-in uses closes only.
Our page on the SMA vs the EMA covers that smoothing step.
How we tested the RVI
- Data for the test: MetaTrader 4, build 1471, terminal history from Capital Point Trading, read straight from the .hst files.
- Symbols: 23 FX pairs, from AUDCAD to USDJPY, including EURUSD, GBPUSD, USDCHF and AUDUSD.
- Timeframe and window: daily bars, 12 June 2018 to 24 August 2026.
- Indicator: RVI with a 10-bar standard deviation and 14-bar EMA smoothing, as in the formula above.
- Outcome: was the close 10 days later higher than the close on the signal day?
- Charts: TradingView web chart, OANDA data, captured on 9 October 2026, with the built-in study at default settings.
We compared every result with the base rate. Across all days in the sample, 52.3% closed higher 10 days later. A signal only matters if it beats that number by a clear margin. All results are before spread, swap and commission. Our editorial testing policy explains how we pick samples and report them.
RVI settings and parameters
The TradingView dialog is short. It shows two inputs only, and the smoothing length sits inside the code.
| Parameter | TradingView default | What it changes |
|---|---|---|
| Length | 10 | Bars in the standard deviation. Shorter makes the line jumpier. |
| Smoothing | 14 (fixed, not shown) | EMA length for the up and down piles. You cannot edit it in the built-in. |
| Offset | 0 | Shifts the plot left or right. Leave it at 0 for live reading. |
| Source | Close (fixed) | The built-in reads closes only, not highs or lows. |
| Bands | 80 and 20 | Dashed guide lines drawn in the pane. There is no 50 line by default. |
Most traders leave Length at 10. With a 14-bar EMA on top, small changes move the line only a little. Tuning it to fit one chart is the fast road to curve fitting.
Reading the relative volatility index on a chart
Read it in three zones. Above 50, up days carried more volatility. Below 50, down days did. Near 80 or 20, one side has dominated for a while.
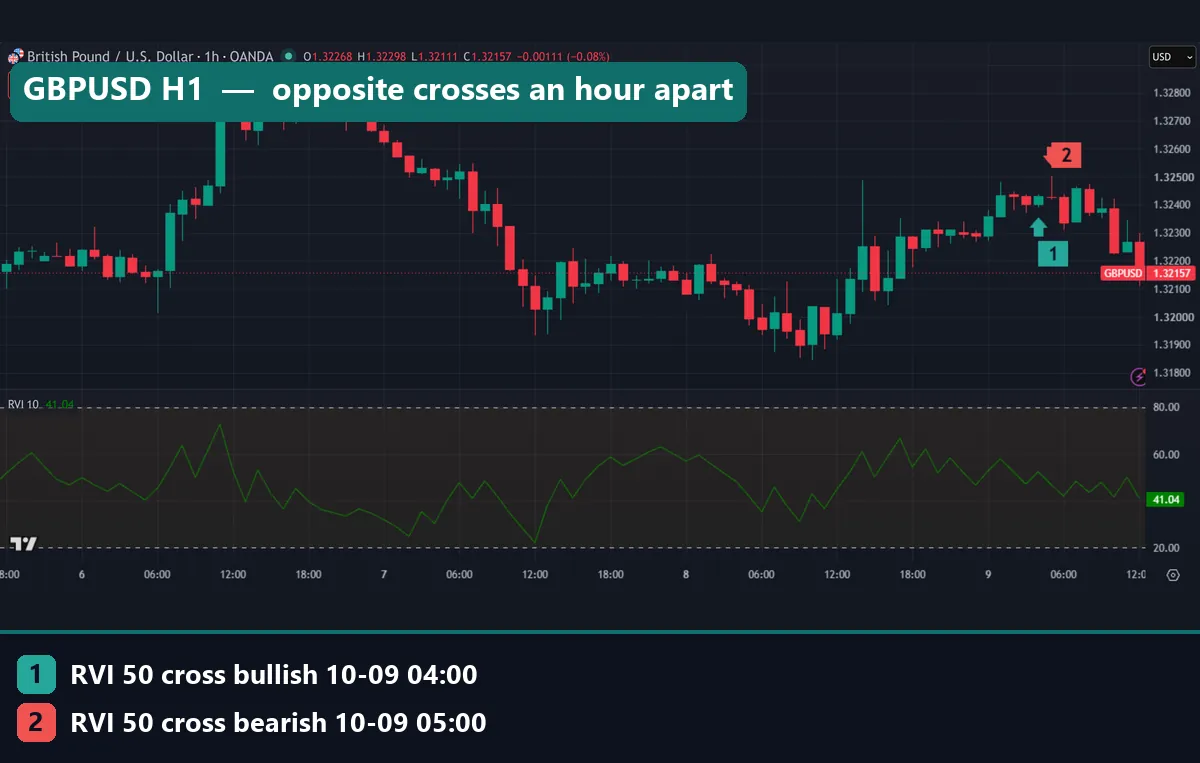
The GBPUSD hourly chart shows the common case: a line that hugs the middle. Marker 1 is a bullish 50 cross at 04:00 UTC on 9 October 2026. Marker 2 is a bearish cross only one hour later, at 05:00. The two closes were 1.32430 and 1.32428, so price had barely moved. In fact, our facts file lists five crosses on that pair between 23:00 on 8 October and 05:00 on 9 October.
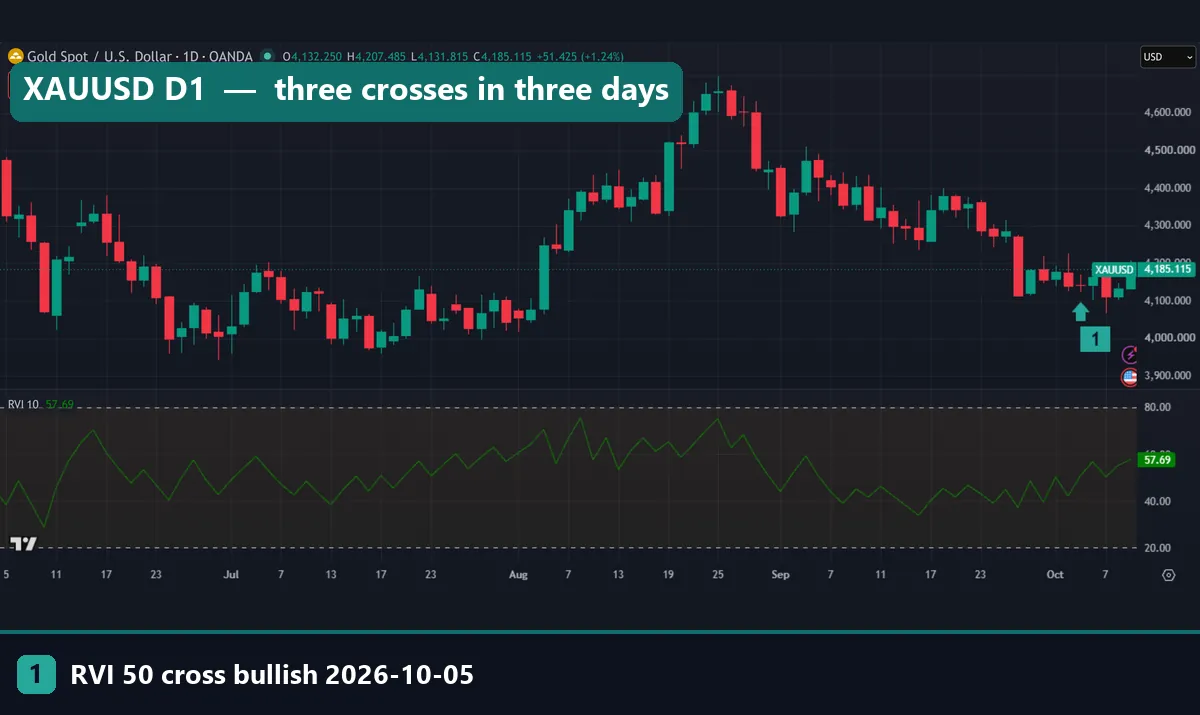
Gold daily shows the same thing in a slower frame. Marker 1 is the bullish cross on 5 October 2026, at a close of $4,140.525. But the RVI had also crossed up on 1 October and down on 2 October. Three crosses in three trading days carry little meaning.
So the 80 and 20 bands are not the same as RSI overbought and oversold levels. A reading near 20 says falling days carried the volatility. It does not say price has gone too far.
Worked example: EURUSD daily, September 2026
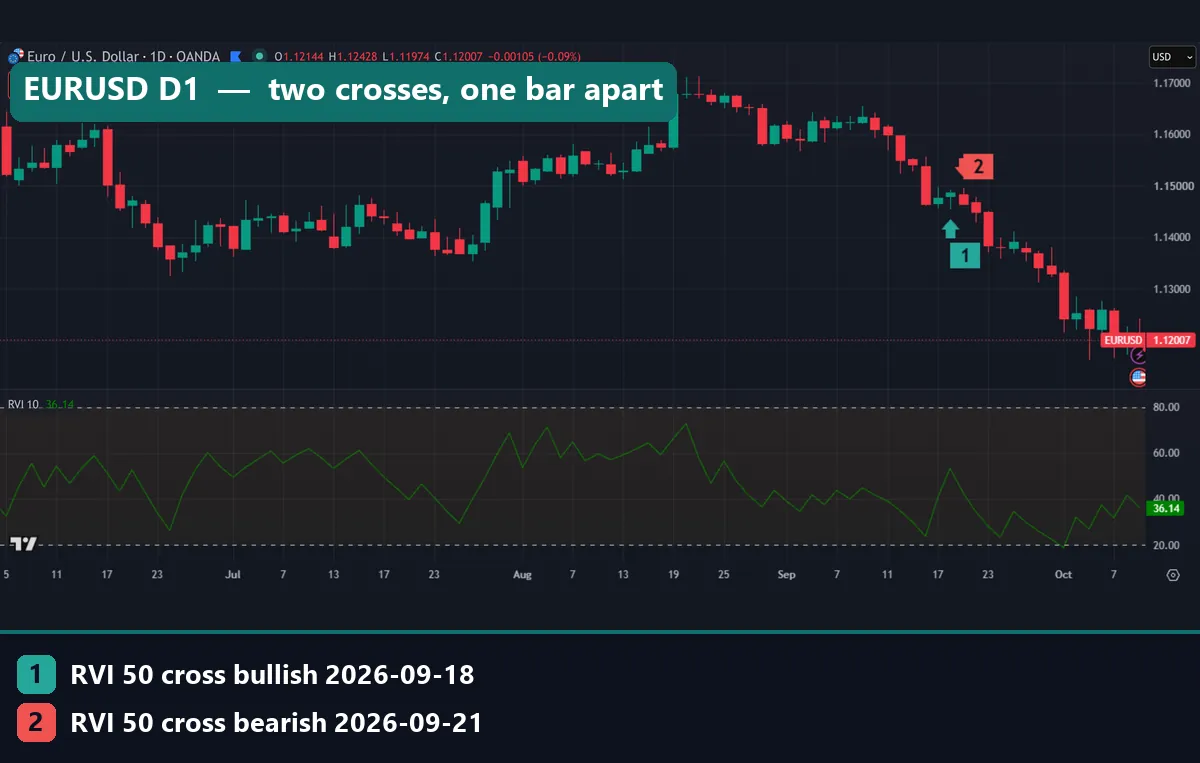
The first image holds a clean pair of signals, so let us walk through it with the real closes.
- On 18 September 2026 the RVI crossed above 50. EURUSD closed at 1.14863 that day (marker 1).
- On 21 September, the next trading day, it crossed back below 50. The close was 1.14640 (marker 2).
- Between the two signals, price fell 22.3 pips. A trader who bought the first cross was told to exit one bar later.
- After marker 2, the chart shows a steady slide. At capture, EURUSD sat at 1.12007, about 263 pips under the bearish cross.
On this one chart the bearish cross looks good. But look further left. In late August the line crossed down on the 24th, up on the 25th and down again on the 26th. Those three signals cancelled each other out.
So one chart can tell any story you want. Thousands of crosses tell a plainer one.
What 23 pairs and eight years showed
We counted 3,889 crosses above 50 and 3,884 crosses below it. That works out to about 169 bullish crosses per pair, or roughly 20 a year. Here is how the 10-day outcomes compared with the base rate.
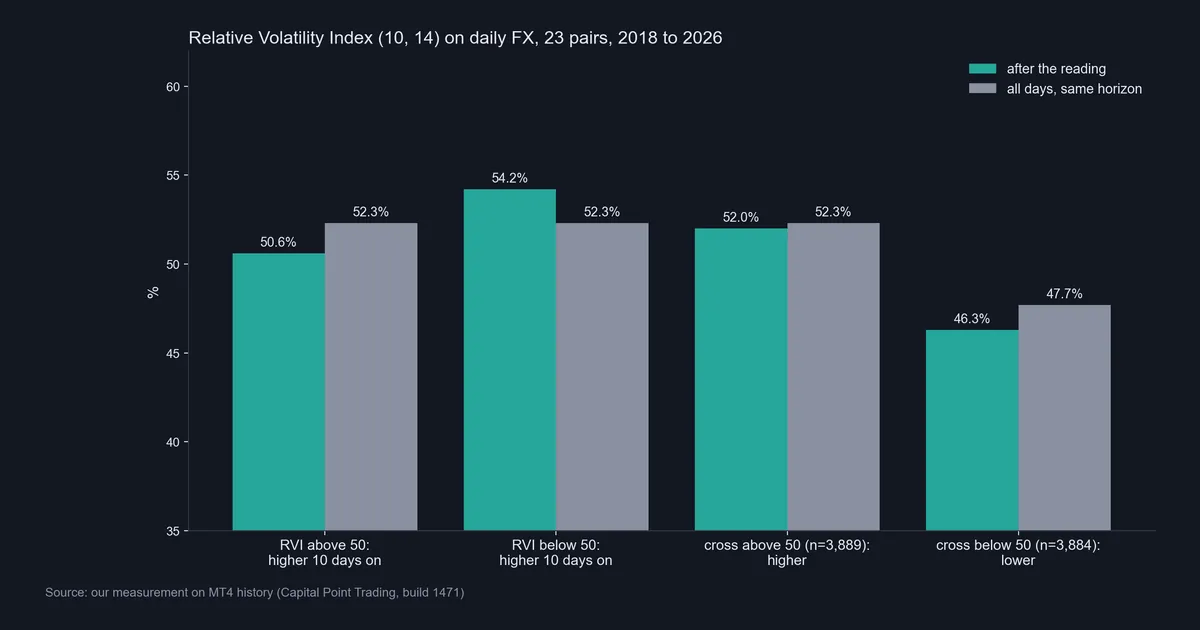
- RVI above 50: price was higher 10 days later 50.6% of the time. The base rate was 52.3%.
- RVI below 50: price was higher 54.2% of the time. That is slightly above the base, the opposite of the textbook reading.
- Cross above 50: higher 10 days later 52.0% of the time, against 52.3% for all days.
- Cross below 50: lower 10 days later 46.3% of the time, against 47.7% for all days.
Every gap is two points or less. With samples this large, that is noise, not a signal. In other words, the 50 line did not sort future direction on daily FX. If anything, readings below 50 leaned a touch toward bounces.
Our guide on backtest sample size explains why a few dozen trades can fool you.
The RVI on hourly charts
We did not run the hourly statistics for this indicator. So treat the next chart as an illustration only, not as evidence.
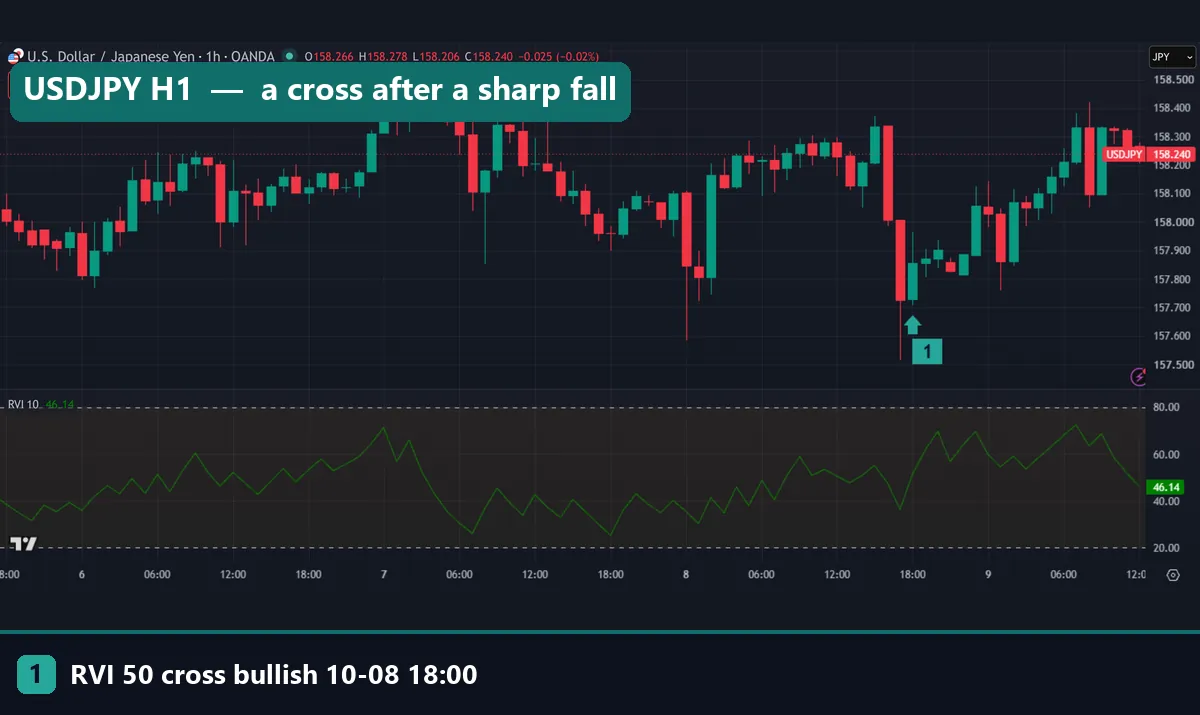
On USDJPY hourly, marker 1 is a bullish cross at 18:00 UTC on 8 October 2026, with a close of 157.856. It came after a sharp fall. Two hours earlier, at 16:00, the line had crossed down with a close of 158.007. After marker 1, price recovered, and the chart closed at 158.240 when we captured it.
Notice what drove the cross. The fall raised the standard deviation, and then one small up bar filed a big number on the up side. Hourly bars also carry session noise, so expect more flips than on daily charts.
Using it the way Dorsey intended
Dorsey’s own use was as a filter, not a trigger. Pair it with an entry tool and let the RVI veto trades against it. For example, take a moving average cross up only while the RVI reads above 50.
Our numbers limit that filter. The above-50 reading alone did not raise the odds of a higher close. Still, a filter cuts trade count, and that lowers costs. Test the pair of tools together.
Another honest use is as a volatility map. A run near 80 or 20 tells you which side has been doing the heavy moving. Combine that with a level tool like ATR for stop size, and you get context, not a call.
Download the complete indicator database
Put these concepts on your charts. One email unlocks the full library of 1,380+ indicators with compiled MT4 and MT5 files, plus my TradingView scripts. No paywall, no spam, unsubscribe any time.
Get free access to my indicator database
One email unlocks 1,380+ free MT4, MT5 and TradingView indicators — the complete library. No single-tool download; you get the whole database.
Where it fails
Here are the limits we found, stated plainly.
- No edge at 50. On 23 daily pairs, crosses in both directions landed within two points of the base rate.
- Whipsaw in quiet markets. Small closes flip the day type, so the line crosses back and forth. GBPUSD hourly crossed five times in six hours.
- Direction only. A one-pip up day counts the same as a 100-pip up day. The size of the move is lost.
- Lag. A 10-bar deviation plus a 14-bar EMA reacts slowly. Big turns often show up after price has already moved.
- Hidden smoothing. The built-in dialog does not show the 14-bar EMA. So you cannot match a different platform’s version just from the inputs.
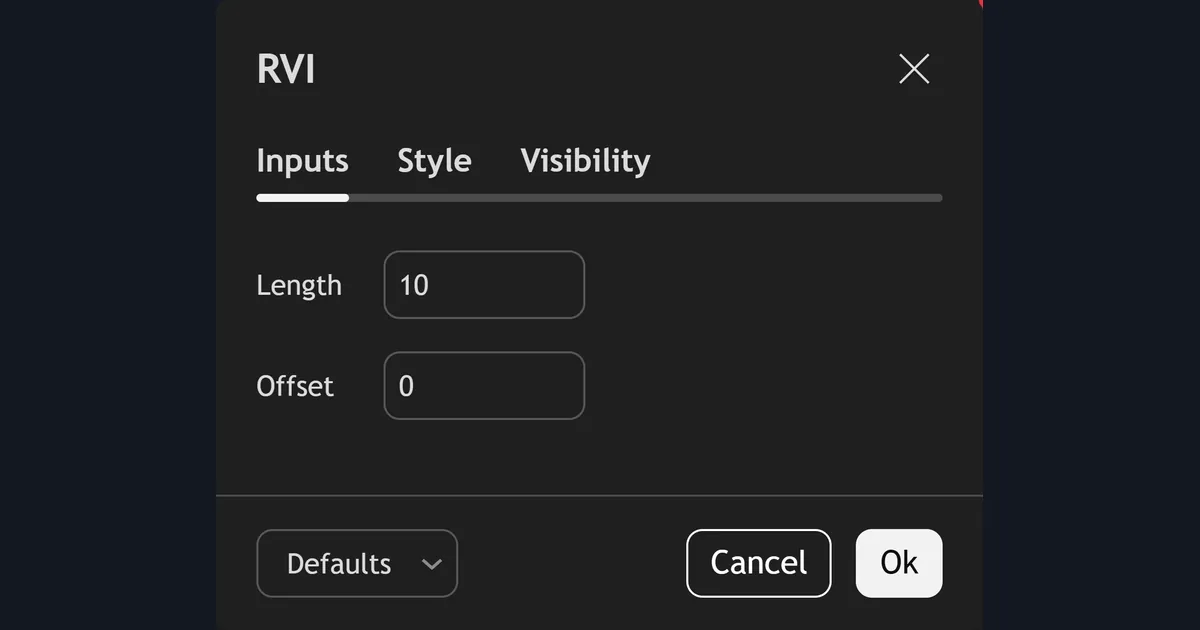
The dialog above shows all you can change: Length 10 and Offset 0.
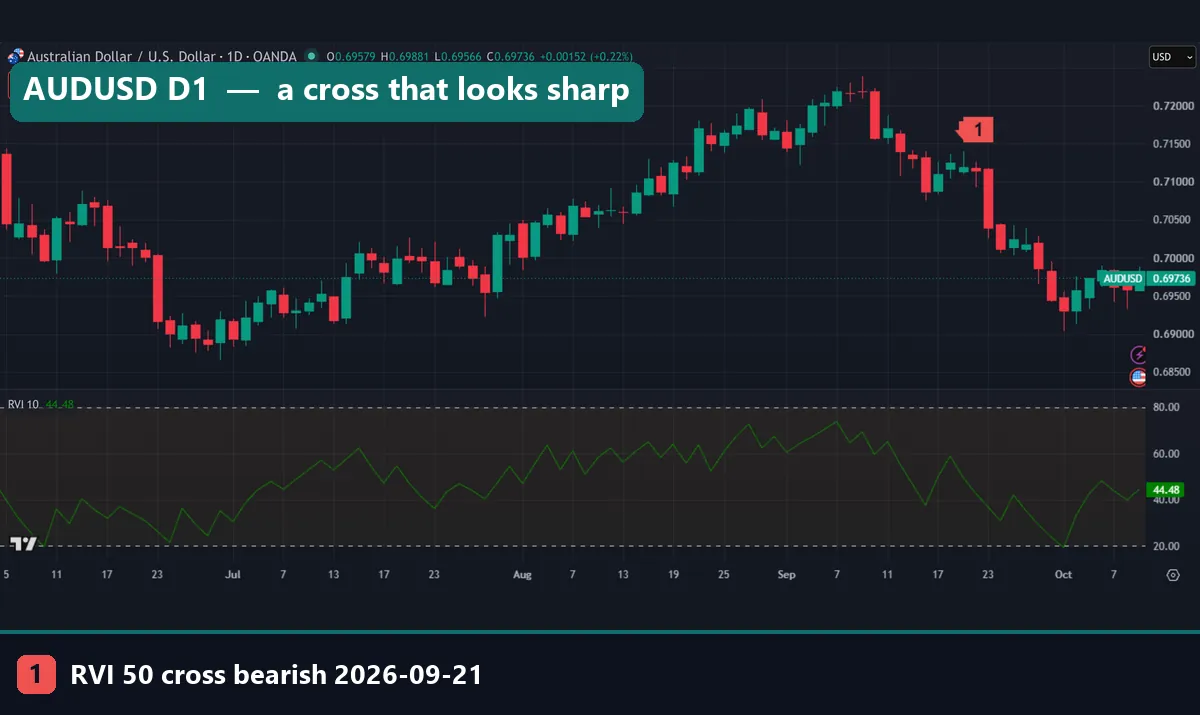
The AUDUSD chart shows why chart examples mislead. Marker 1 is a bearish cross on 21 September 2026, at a close of 0.71194. Price then dropped through 0.70000, so the signal looks sharp. But the same pair crossed down on 15 September and up on 18 September first. Our data says bearish crosses were followed by lower prices less often than an average day. A good-looking example is just one draw.
Common mistakes with the RVI
- Mixing it up with the vigor index. In MetaTrader, “RVI” means vigor. Read the scale and the line count first.
- Treating 80 and 20 like RSI extremes. The bands measure where volatility sat, not how far price has stretched. Our RSI article on false signals covers the same trap on the RSI side.
- Trading every 50 cross. Crosses came about 20 times a year per pair and showed no edge. Each one also costs spread.
- Ignoring costs in tests. Our results are before spread, swap and commission. Read about backtesting transaction costs before you trust any result, ours included.
Where to go next
To compare the two RVIs side by side, start with our relative vigor index guide, which ran the same kind of test on signal-line crosses. For the parent tool, see our RSI settings guide.
Bollinger Bands and Bollinger Band Width also use standard deviation, but show its size, not its direction. For a plain view of which pairs move most, read our page on forex pair volatility. To check trend strength next to it, try the ADX indicator.
For outside sources, TradingView’s Relative Volatility Index help page at TradingView describes the built-in. The relative strength index article on Wikipedia covers the RSI frame that Dorsey borrowed.
FAQ: relative volatility index questions
Who created the relative volatility index?
Donald Dorsey introduced it in 1993 in Technical Analysis of Stocks & Commodities. He later published a refined version that averages readings built on highs and on lows.
What is the default setting on TradingView?
Length 10 and Offset 0. The 14-bar EMA smoothing is fixed in the code and does not appear in the dialog.
Is the relative volatility index the same as the RVI in MT4?
No. The built-in RVI in MetaTrader 4 and 5 is the relative vigor index. It swings around zero and has a signal line, while the volatility index runs from 0 to 100.
What does a reading above 50 mean?
It means up days carried more of the recent volatility than down days. In our daily test, that reading did not lead to more higher closes 10 days later.
Are 80 and 20 overbought and oversold levels?
Not in the RSI sense. They show that one side has carried most of the volatility for a while, not that price has stretched too far.
Did the 50-line cross work in your test?
No clear edge. Bullish crosses were followed by a higher close 52.0% of the time against a 52.3% base, and bearish crosses by a lower close 46.3% of the time against 47.7%.
Can I use it on hourly charts?
You can, but expect more flips. We did not measure hourly results for this indicator, so our examples there are illustrations only.
Should I change the Length input?
Test it before you trust it. The 14-bar EMA dampens most changes to Length, and tuning it to one chart invites curve fitting; results are not guaranteed; past performance is not indicative of future results.
Last updated: 9 October 2026.

About the author
Written by Dominic Walsh, a Forex trader and MT4/MT5 indicator, Expert Advisor and script developer. Every tool on forexmt4systems.com is tested on live charts before release and ships with ready-to-use compiled MT4 (.ex4) and MT5 (.ex5) files. Learn more about the trader and developer behind this site.
How we build, test and correct every tool: Editorial & Testing Policy. Trading carries risk; see the disclaimer.