
Three black crows is a bearish candlestick pattern: three long red candles in a row, each closing lower and near its own low. Textbooks read it as a sign that a rise has ended. We coded a strict version and ran it over daily bars for 11 currency pairs, from 2002-2004 to November 2026, which gave us 459 crows. This guide settles one question: did the pattern predict further falls on daily forex charts? On our data it did not. Price was lower five days later only 47.1% of the time.
What the three black crows pattern is
The pattern needs three bearish candles in a row. Each one closes below its open, and each close in the run sits lower than the one before. The bodies are long and the lower wicks short, so every session ends near its low. Most books add one more condition: the second and third candles open inside the body of the candle before. On a chart, it looks like a staircase going down.
The pattern has a mirror image. Three green candles that climb the same way form three white soldiers. Wikipedia’s entry on three black crows gives the classic reading: a turn from a rising market to a falling one. It also sits in most lists of bearish candlestick patterns, next to the evening star.
Definitions differ in the details, and the details change the count. For example, TA-Lib’s CDL3BLACKCROWS reference page treats it as a four-bar pattern that starts with a white candle. It also notes that the code does not check for a prior uptrend. So two scanners can disagree about the same chart, and both can be right by their own rules.
How it works: the rule we coded
A pattern only becomes testable once it turns into a rule. Ours has five parts. ATR(14) is the average true range over 14 bars, and our guide to what ATR measures explains it.
- Long bodies:
open - close >= 0.5 x (high - low)on all three candles. - Weak closes:
(close - low) / (high - low) <= 0.25, so each close sits in the lowest quarter of its range. - Falling closes: the second close is below the first, and the third below the second.
- Opens inside the last body: candles two and three open between the previous open and close, with 0.1 ATR(14) of slack below that close.
- A real first candle: its range is at least 0.5 ATR(14).
The slack matters on forex. A 24-hour market usually opens a new daily bar right where the last one closed, so one tick under the close should not throw out a clean crow. Three white soldiers use the same rules turned upside down.
We also tagged context. A crow came “after a rise” when the close before it sat above its 20-bar simple moving average and above the close five bars earlier. “After a fall” is the mirror case, and the rest count as “mixed”.
How we tested
We pulled OANDA daily bars from the TradingView web chart on 16 and 17 November 2026. We left out the candles dated 17 November, since they had not closed yet. The pairs were EUR/USD, GBP/USD, USD/JPY, AUD/USD, USD/CAD, USD/CHF, NZD/USD, EUR/JPY, GBP/JPY, AUD/JPY and EUR/CHF.
Four pairs start on 6 May 2002, most others in late September or early October 2003, and AUD/JPY on 31 May 2004. The windows end on 3 or 6 November 2026, depending on the pair, for 67,293 pair-days in total.
For each crow, we checked the close 1, 5 and 10 bars after the third candle. A crow “continued” when that close sat below the third close. We also checked whether price got back to the middle of the pattern, halfway between the first open and the third close, within 10 bars. As a baseline, any day was followed by a lower close five days later 48.6% of the time.
For a second opinion, we ran the same rule on MetaTrader 4, build 1471, with Capital Point Trading history: 23 pairs, daily bars, windows from June 2018 to August 2026 by pair. The US dollar majors there start on 19 May 2020. That terminal has been offline since late August 2026, so its data stops then. All results are before spread, swap and commission, and the method follows our editorial testing policy.
The settings behind every number
Every percentage here depends on these choices. Change one, and the count changes too.
| Setting | Value we used | Why |
|---|---|---|
| Chart and feed | OANDA daily (1D) on TradingView | Long histories for major pairs |
| Candle colour | Close below open, all three | The base condition |
| Body size | At least 50% of the range | Drops small-bodied candles |
| Close position | Lowest 25% of the range | “Closes near the low” |
| Close sequence | Each close below the last | The staircase shape |
| Open of candles 2 and 3 | Inside the previous body, 0.1 ATR(14) slack | Forex bars open where they closed |
| First candle range | At least 0.5 ATR(14) | A real move, not a quiet day |
| Trend tag | 20-bar SMA and 5-bar change | Splits rises from falls |
| Outcome check | Close 1, 5 and 10 bars later | Candle traders work short-term |
| Costs | None | Spread and swap lower every result |
These values follow the textbook description. They are a choice, not a law.
Reading three black crows on a chart
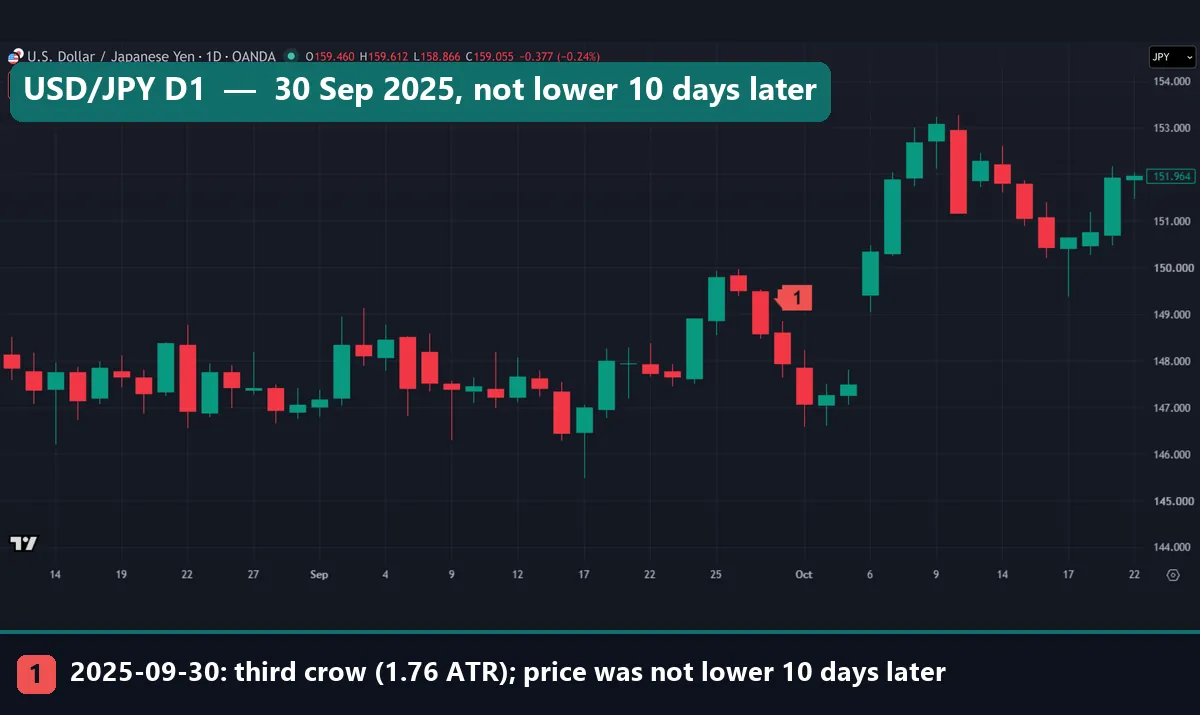
The USD/JPY chart shows the textbook setup. Price had climbed from about 146 in mid-September 2025 to near 150 by the 25th. Then three red candles stepped down, and the third closed at 147.94 on 30 September. The pattern measured 1.76 ATR, and it came after a rise, exactly where the books say it matters.
It did not hold. Price dipped once more and went flat for two days. Then it opened the next week above 149 and climbed past 152. Ten days after the third crow, USD/JPY sat well above 147.94, so the crows marked a pause, not a top.
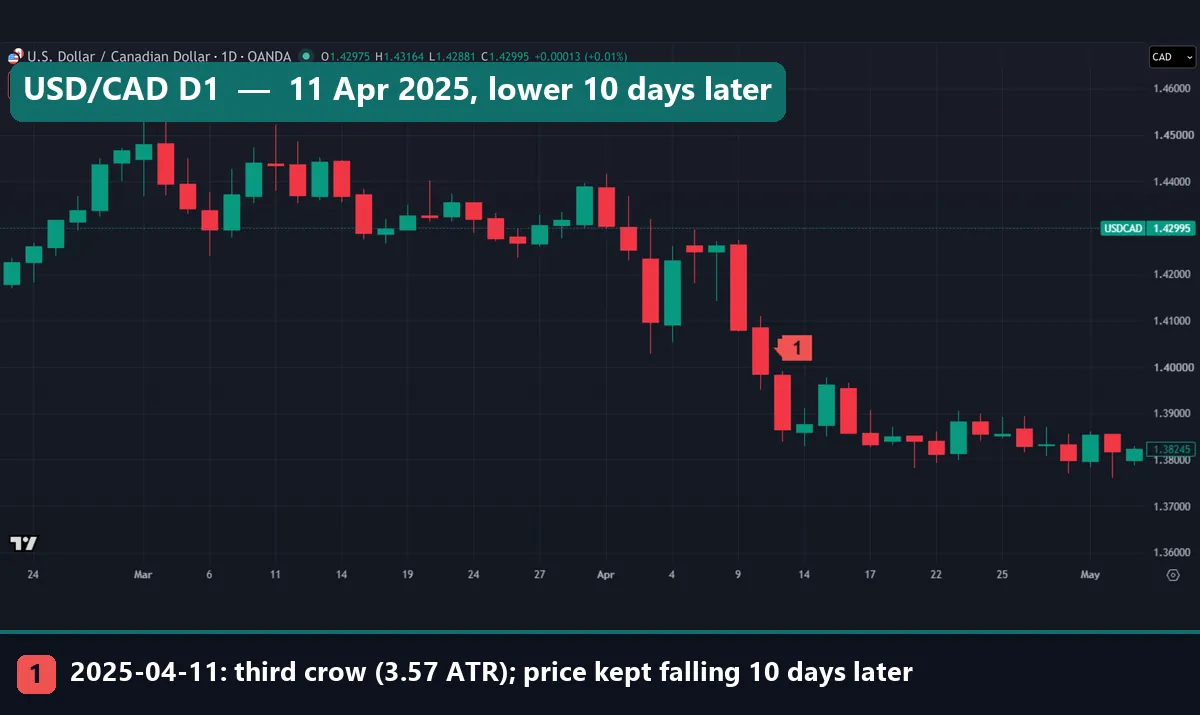
The USD/CAD chart shows the other outcome. Here the third crow closed at 1.38652 on 11 April 2025, and the pattern measured 3.57 ATR, a large one. This time it came after a fall. Price bounced for two days, then drifted lower and sat under the third close ten days later.
In both charts, the crows only become clear once the third candle has closed. By then, a move of 1.76 or 3.57 ATR is already done. So the real question is what happens from the third close onward.
Worked example: AUD/USD in October 2024
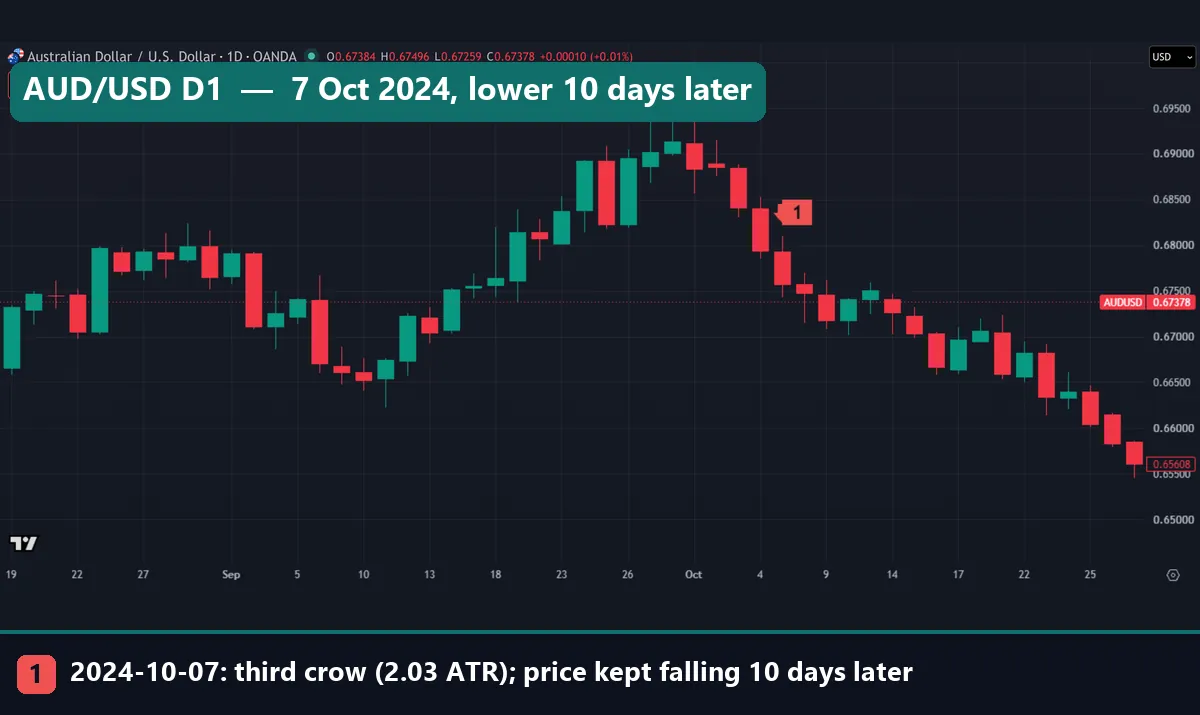
The first chart in this guide is the cleanest recent case in our scan. AUD/USD topped near 0.69 in late September 2024. A few sessions later, three long red candles stepped down, and the third closed at 0.67569 on 7 October. Before the pattern, the close sat above its 20-bar average and above the close five bars earlier, so our rule tagged it “after a rise”.
- Size: 2.03 ATR(14), below the median of 3.02 ATR for all 459 crows.
- Five bars later, the close sat below 0.67569, so it continued at five bars.
- Ten bars later, price was still lower, so it continued at ten bars too.
- By the chart’s last bar, in late October, AUD/USD traded near 0.656.
On this one chart, the pattern looks perfect. But NZD/USD printed a crow on the same day, and it also continued. Two pairs that move together are close to one event, as our forex correlation matrix shows for the Australian and New Zealand dollars.
The last 15 crows in our scan
One good chart proves little, so here are the 15 most recent crows our scan lists.
| Third candle | Pair | Context | Size (ATR) | Lower 5 bars later | Lower 10 bars later |
|---|---|---|---|---|---|
| 2024-08-01 | GBP/JPY | After a fall | 3.52 | Yes | No |
| 2024-08-01 | EUR/CHF | After a fall | 3.74 | No | No |
| 2024-08-02 | USD/CHF | After a fall | 4.40 | No | No |
| 2024-08-02 | EUR/JPY | After a fall | 2.70 | No | No |
| 2024-08-02 | GBP/JPY | After a fall | 3.62 | Yes | No |
| 2024-08-02 | EUR/CHF | After a fall | 3.98 | No | No |
| 2024-08-20 | USD/CHF | Mixed | 2.20 | Yes | Yes |
| 2024-08-28 | EUR/CHF | Mixed | 1.73 | No | No |
| 2024-10-07 | AUD/USD | After a rise | 2.03 | Yes | Yes |
| 2024-10-07 | NZD/USD | After a rise | 2.15 | Yes | Yes |
| 2025-04-11 | USD/CAD | After a fall | 3.57 | Yes | Yes |
| 2025-07-15 | GBP/USD | After a fall | 1.94 | No | Yes |
| 2025-07-28 | GBP/USD | After a rise | 2.70 | Yes | No |
| 2025-09-30 | USD/JPY | After a rise | 1.76 | No | No |
| 2025-10-16 | USD/CHF | After a rise | 2.08 | No | No |
Seven of the 15 were lower five bars later, but only five were lower ten bars later. Six came on 1 and 2 August 2024, a point we return to below.
What 459 crows did next
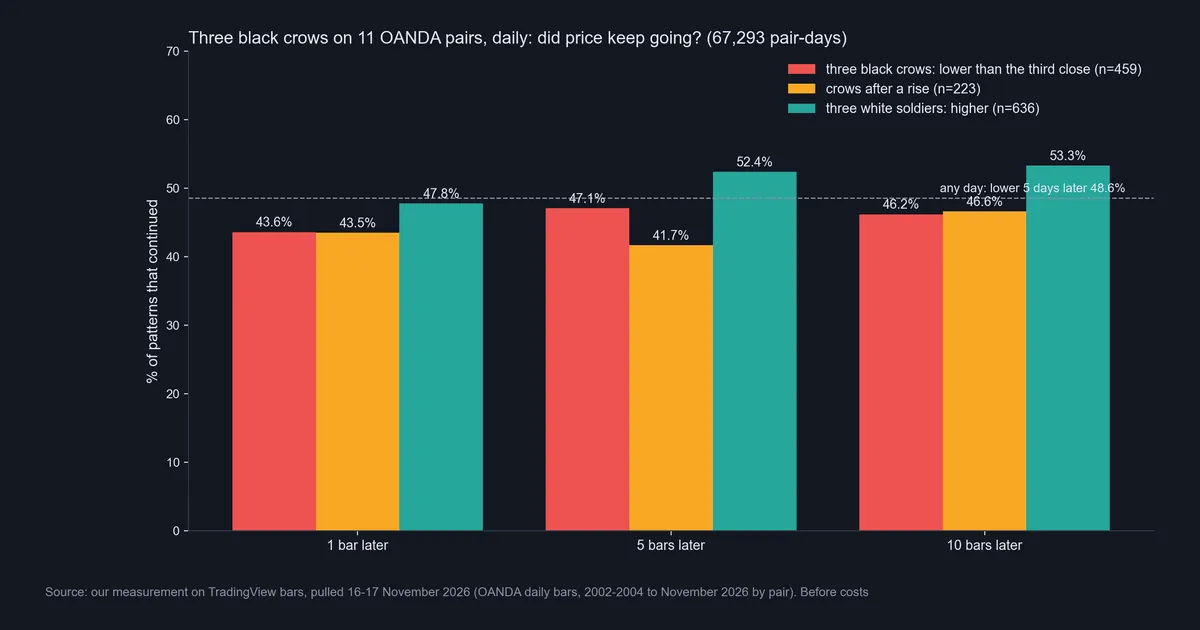
Across all 11 pairs, the rule found 459 crows. One bar after the third candle, price was lower only 43.6% of the time. Five bars later the figure was 47.1%, and ten bars later 46.2%. Any day, by comparison, led to a lower close five days later 48.6% of the time. The gap is small enough to be noise, but it points the wrong way for the pattern.
The textbook setting did not help either. Crows after a rise, the case the books describe, were lower five bars later just 41.7% of the time, across 223 cases. Crows after a fall reached 50.7% of 138 cases, close to the baseline. Meanwhile, the median ten-bar move went 0.30 ATR against the pattern, so a typical crow saw price drift up.
Price also clawed back part of the drop. In 56.4% of cases, it returned to the middle of the pattern within ten bars.
Three white soldiers, the bullish mirror, held up a little better. Across 636 cases, they were higher five bars later 52.4% of the time and ten bars later 53.3%. Still, since 48.6% of all days led to a lower close, at most 51.4% led to a higher one. So the soldiers beat a random day by only a hair.
The MT4 cross-check: the feed changes the count
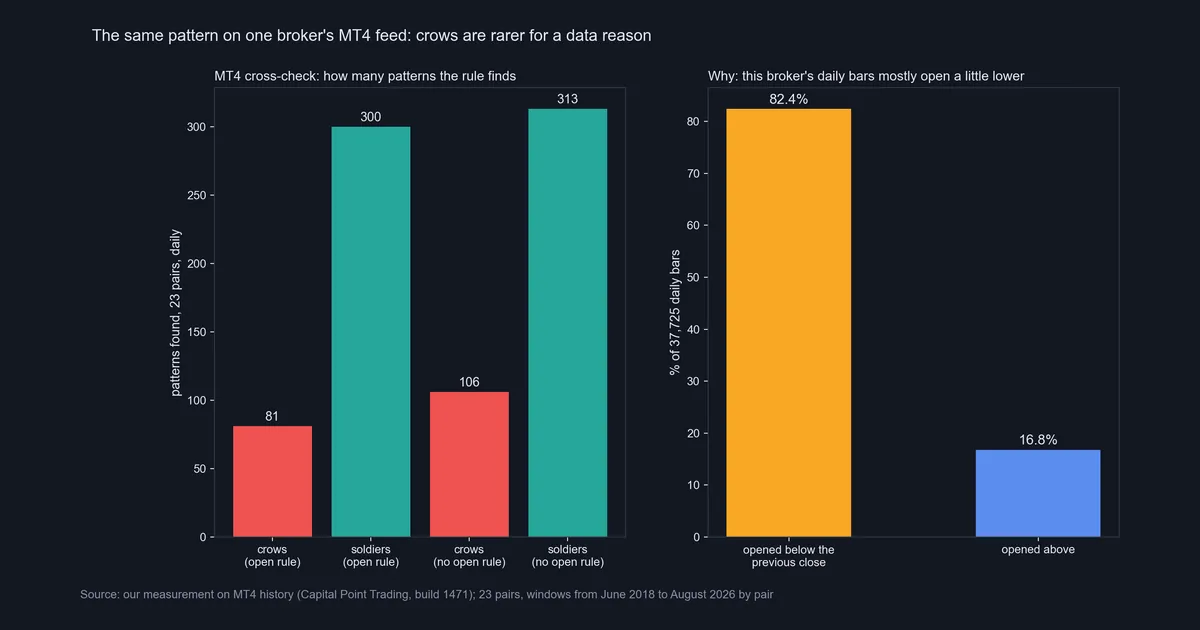
On one broker’s MT4 history, the same rule gave lopsided counts: 81 crows but 300 white soldiers across 23 pairs. On the OANDA bars, by contrast, the split was 459 to 636.
The cause sits in the opens. On this broker, 82.4% of daily bars opened a little below the previous close, and only 16.8% opened above it. MT4 draws candles from the bid, and spreads tend to widen around the daily rollover, so the first bid of a new day often sits a touch lower. That dip shifts every body. A red candle starts lower and looks shorter, while a green one starts lower and looks longer.
With the open rule switched off, the count rose to 106 crows and 313 soldiers. We think most of the remaining gap comes from the same dip through body sizes, plus a different sample: shorter windows, most starting between 2018 and 2020, and six yen crosses among the 23 pairs. In short, a candle-pattern count belongs to the feed and the window, not to the market alone.
Nor did the MT4 outcomes rescue the pattern. Crows there were lower five bars later 50.6% of the time and ten bars later 45.7%.
Download the complete indicator database
Put these concepts on your charts. One email unlocks the full library of 1,380+ indicators with compiled MT4 and MT5 files, plus my TradingView scripts. No paywall, no spam, unsubscribe any time.
Get free access to my indicator database
One email unlocks 1,380+ free MT4, MT5 and TradingView indicators — the complete library. No single-tool download; you get the whole database.
Where it fails
The main failure is plain: on daily forex bars, three black crows did not predict lower prices. Here are the specific limits.
- It reports the past. The pattern only exists once the third candle closes, after a median move of 3.02 ATR.
- Clusters inflate the sample. Six of the last 15 crows came on 1 and 2 August 2024, across GBP/JPY, EUR/JPY, EUR/CHF and USD/CHF. None of the six was lower ten bars later.
- The definition moves the count. On MT4, dropping one condition took the count from 81 to 106.
- Studies score it differently. Thomas Bulkowski’s three black crows page rates it highly. But he scores a close below the pattern’s low as bearish and needs a close above its top for bullish. With price ending near the low, the bearish side has a far shorter path. We asked a plainer question: was price lower N bars later?
- No costs. Spread and swap are left out. Our guide to backtesting transaction costs shows how fast they eat a thin edge.
- Forex, mostly daily. Apart from a small hourly check, we did not test other timeframes, stocks, indices or crypto.
Three strong down days do show that sellers ran three sessions. They just do not tell you what comes next.
Two crows that turned around
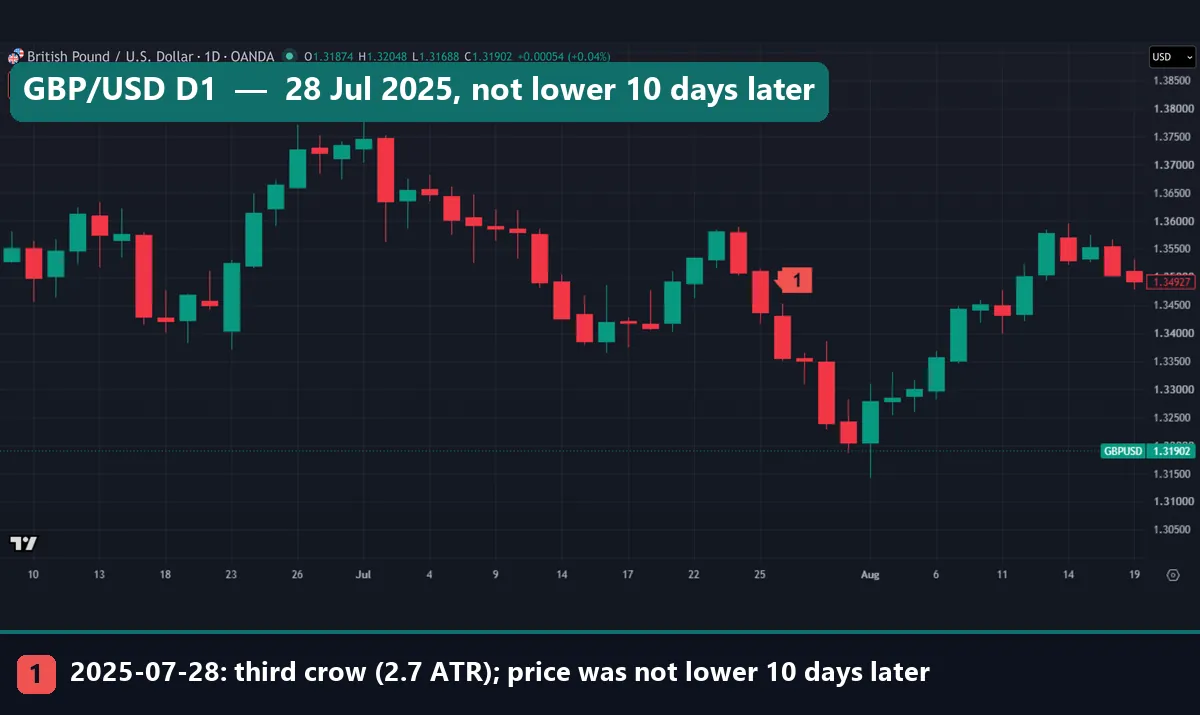
GBP/USD shows how a crow can work for a week and still fail. The third candle closed at 1.33548 on 28 July 2025, after a climb from about 1.34 in mid-July to near 1.358. Price fell further and was lower five bars later. Then it turned up hard in early August and stood above the third close ten bars later.
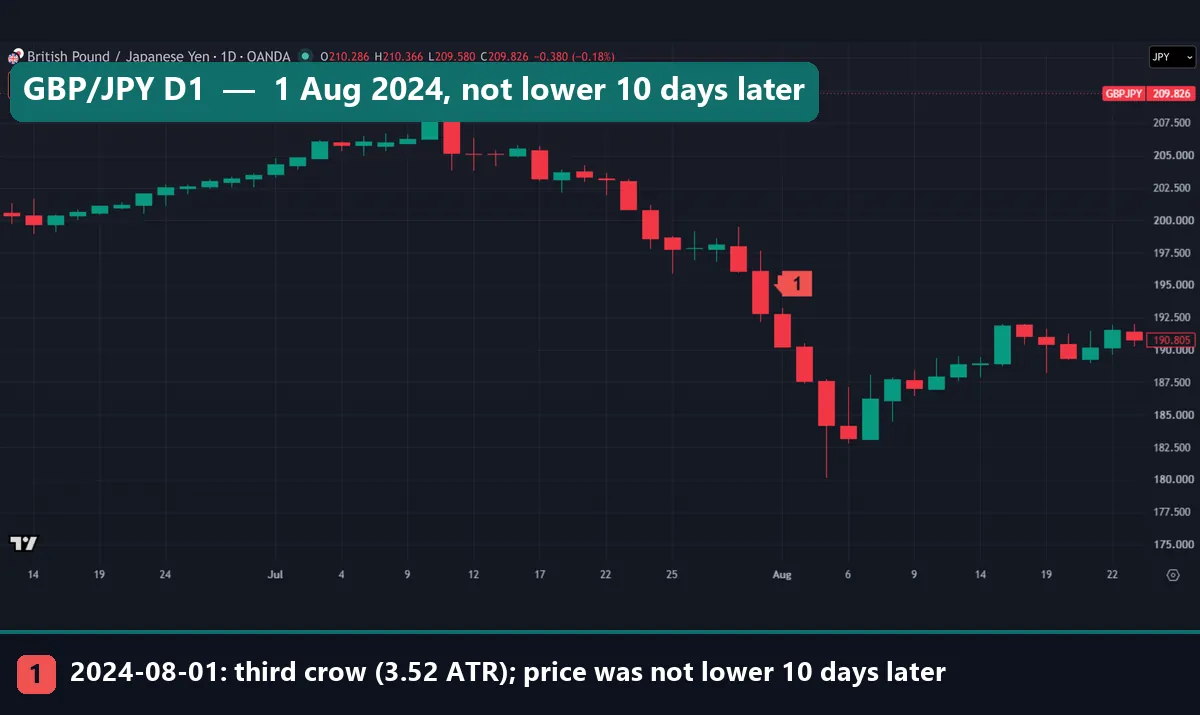
GBP/JPY in August 2024 is the extreme case. The third crow closed at 190.248 on 1 August, a 3.52 ATR pattern after a fall. Two sessions later, on 5 August, a candle left a long lower wick near 180. Yet ten bars after the pattern, the pair stood back above 190.248. That was the sharp yen rally of early August 2024, and our guide to a carry trade unwind explains the mechanics behind moves like it.
Both charts make the same point. A crow tells you selling was strong for three sessions, but not who is left to sell.
Four common mistakes
1. Calling any three red candles a crow. Small bodies, long lower wicks or mid-range closes all fail the rule. A true crow candle looks closer to a marubozu than to a spinning top.
2. Shorting the third close by reflex. Price was lower five bars later 47.1% of the time and got back to the pattern’s middle within ten bars 56.4% of the time. If you are going long, a crow is a reason to check your stop, not proof that the trend has ended.
3. Ignoring the feed. Our rule found 459 crows on OANDA bars and 81 on one MT4 history, with different windows and pairs. So test on the data you actually trade.
4. Trusting a handful of examples. The AUD/USD chart looks like a lesson, yet the full sample says otherwise. Clusters like 1 August 2024 also shrink the number of independent events. Our guide to backtest sample size explains why a few hundred cases can still mislead.
Where to go next
For the wider family, our Japanese candlestick cheat sheet lays out the main shapes on one page. For the general case for and against candle signals, read do candlestick patterns work. Then the dragonfly doji guide covers a one-candle shape that traders watch at the bottom of a drop.
Crows sometimes appear at the break of a larger chart pattern, such as the descending triangle pattern. For a second view on context, StockCharts’ ChartSchool page on bearish reversal patterns argues that a reversal needs an existing uptrend and some bearish confirmation. Our “after a rise” split tested the first half of that advice, and it did not help.
FAQ: three black crows
Is three black crows bullish or bearish?
It is bearish by name and by the textbook reading. On our daily forex data, though, price was lower five bars later in 47.1% of 459 cases, against 48.6% for any day.
How reliable is the three black crows pattern?
As a sell signal on daily forex, it was not reliable in our test. Price returned to the middle of the pattern within ten bars in 56.4% of cases, and the median ten-bar move went 0.30 ATR against it.
What is the difference between three black crows and three white soldiers?
They are mirror images: three falling red candles against three rising green ones. On the same OANDA bars, soldiers were higher five bars later in 52.4% of 636 cases.
Does the pattern work better after an uptrend?
Not on our data. Crows after a rise were lower five bars later only 41.7% of the time, across 223 cases, which is worse than the full set.
Why does my MT4 scanner find fewer crows than TradingView?
Your broker’s feed may open daily bars below the previous close. On one MT4 history, 82.4% of daily bars did, and the same rule found 81 crows but 300 soldiers.
Does three black crows work on the hourly chart?
We ran the rule on MT4 hourly bars for EUR/USD, GBP/USD, USD/JPY and gold, from July or December 2025 to August 2026. It found 55 crows, and only 40.0% were lower five bars later. That sample is small, but it gave no sign of an edge.
Where should a stop go after three black crows?
We did not test stops. Still, price got back to the middle of the pattern within ten bars in 56.4% of cases, so a stop at the midpoint sits inside normal noise.
Can I trade three black crows on its own?
On our data it showed no edge on its own, and every figure here is before costs. Treat it as a record of three strong selling sessions, then look for a reason that does not come from the candles. As with any pattern study, results are not guaranteed; past performance is not indicative of future results.
Last updated: 17 November 2026.

About the author
Written by Dominic Walsh, a Forex trader and MT4/MT5 indicator, Expert Advisor and script developer. Every tool on forexmt4systems.com is tested on live charts before release and ships with ready-to-use compiled MT4 (.ex4) and MT5 (.ex5) files. Learn more about the trader and developer behind this site.
How we build, test and correct every tool: Editorial & Testing Policy. Trading carries risk; see the disclaimer.