
The RSI based MA is the second line that TradingView draws inside its built-in RSI pane: a 14-bar simple moving average of the RSI itself, shown in yellow on our charts. Many traders treat a cross of RSI over that line as a buy or sell trigger. This guide explains what the line is, how it is calculated, and what happened when we counted 6,599 of those crosses on 23 daily FX pairs. In short, the cross told us nothing that a coin flip would not.
What the RSI based MA actually is
RSI stands for Relative Strength Index. J. Welles Wilder introduced it in 1978, and the history and formula of the Relative Strength Index on Wikipedia covers the original work. The RSI turns recent gains and losses into one number between 0 and 100.
The RSI based MA is not part of Wilder’s design. Instead, it is an add-on that TradingView places in the “Smoothing” section of its RSI settings. It takes the RSI values and averages them. So it averages an oscillator, not price. It can never tell you where price is, only where RSI has been on average.
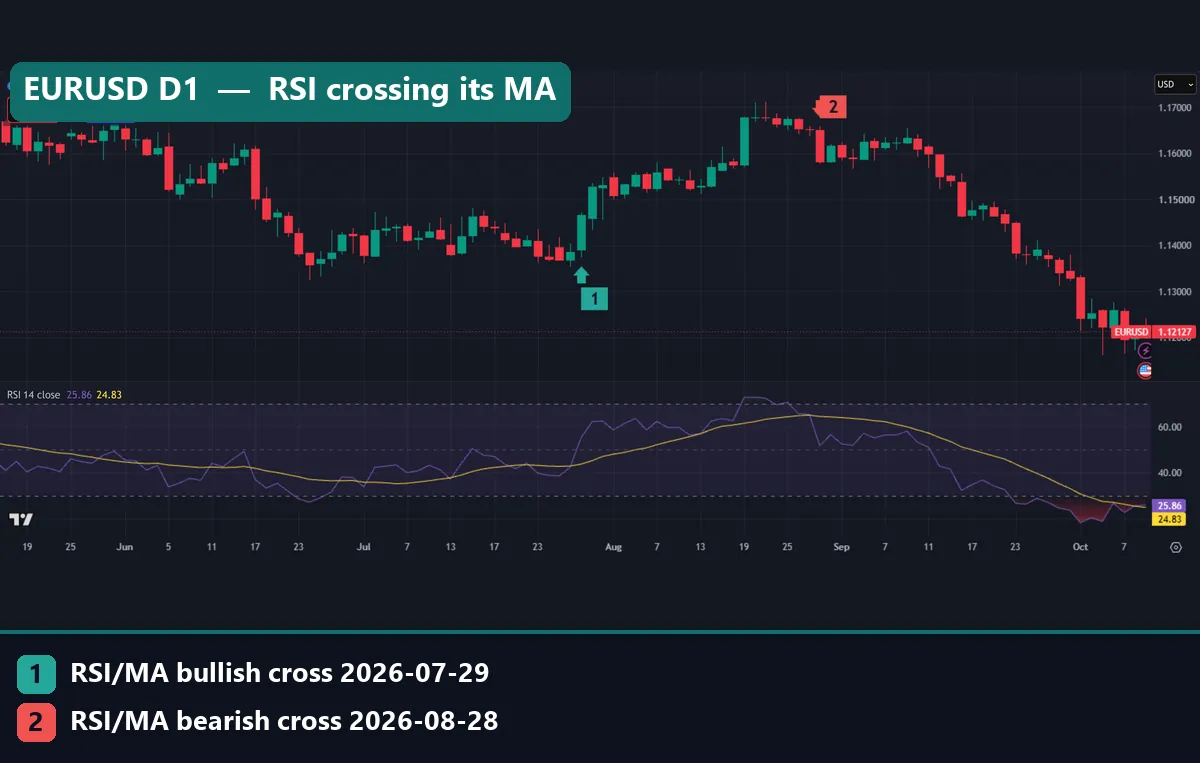
On our charts the RSI is the purple line and the RSI based MA is the yellow line. The legend shows RSI first and the MA second, for example “17.74 27.41” on the EURUSD chart above.
How the RSI based MA works: the formula
First, the RSI. For each bar, the indicator splits the change in close into a gain or a loss. Next, it smooths the gains and the losses with Wilder’s method over 14 bars. Then it divides the two:
RS  = average gain (14) / average loss (14)
RSI = 100 - 100 / (1 + RS)
Second, the moving average. With the default settings, TradingView simply adds the last 14 RSI values and divides by 14:
RSI-based MA = (RSI[0] + RSI[1] + ... + RSI[13]) / 14In Pine Script the same idea fits on two lines: r = ta.rsi(close, 14) and ma = ta.sma(r, 14). A “bullish cross” is the bar where RSI closes above the MA after closing below it on the bar before. A “bearish cross” is the reverse.
Because the MA averages 14 RSI values, and each RSI value already reflects about 14 bars of price, the yellow line reacts slowly. That lag is the whole point of the line. But the cross then arrives after much of the move. Our page on how moving averages are built and why they lag explains why.
How we tested the RSI based MA cross
Our question: after RSI crosses its MA, does price follow the cross more often than it moves that way on any bar? So we compared each cross with a base rate from all bars over the same horizon.
- Data: MetaTrader 4, build 1471 (Capital Point Trading terminal), read straight from the history files.
- Daily test: 23 FX pairs, from 12 June 2018 to 24 August 2026, 37,748 daily candles in total.
- Hourly test: H1 history for 4 symbols from the same terminal.
- Rule: RSI(14) with Wilder smoothing, and its SMA(14), which matches TradingView’s default. We logged every cross of RSI over or under the MA.
- Outcome: was the close 5 bars later higher (after a bullish cross) or lower (after a bearish cross)? That means 5 days on D1 and 5 hours on H1.
- Charts: TradingView web chart, OANDA data, captured on 5 October 2026.
All results are before spread, swap and commission. This terminal stores no usable spread data, so real trades would do worse. Our editorial testing policy explains how we pick data and report results.
Settings and parameters
Our sixth image shows the RSI settings dialog. These are the inputs that shape the RSI based MA, with the default values we used.
| Input | Default | What it changes |
|---|---|---|
| RSI Length | 14 | Bars used for the Wilder average of gains and losses. |
| Source | Close | The price fed into the RSI. |
| Calculate Divergence | Off | Marks divergences; it does not touch the MA. |
| Smoothing Type | SMA | The kind of average drawn over the RSI. |
| Smoothing Length | 14 | How many RSI values the yellow line averages. |
| BB StdDev | 2 (greyed out) | Only active when a Bollinger option is chosen as the type. |
TradingView’s own note on what the Smoothing section in indicator settings does, at the TradingView Help Center describes these fields. A shorter smoothing length makes the yellow line hug the RSI and cross more often. A longer one makes it slower, so crosses are rarer but later. For the RSI length itself, our guide to RSI length and level settings compares the common choices.
Reading the RSI based MA on a chart
Start with where the two lines sit. When RSI runs above its MA, recent momentum is stronger than its own 14-bar average. When it runs below, momentum is weaker. A rising yellow line means momentum has built for some weeks.
The EURUSD daily chart at the top shows both phases. Marker 1 is the bullish cross on 29 July 2026. RSI then stayed above the yellow line through most of August as price climbed toward 1.17. Marker 2 is the bearish cross on 28 August 2026. After it, RSI stayed under the MA, and by the capture date both lines were near the bottom of the pane at 17.74 and 27.41.
On H1 the two lines weave around each other far more, and crosses come in clusters.
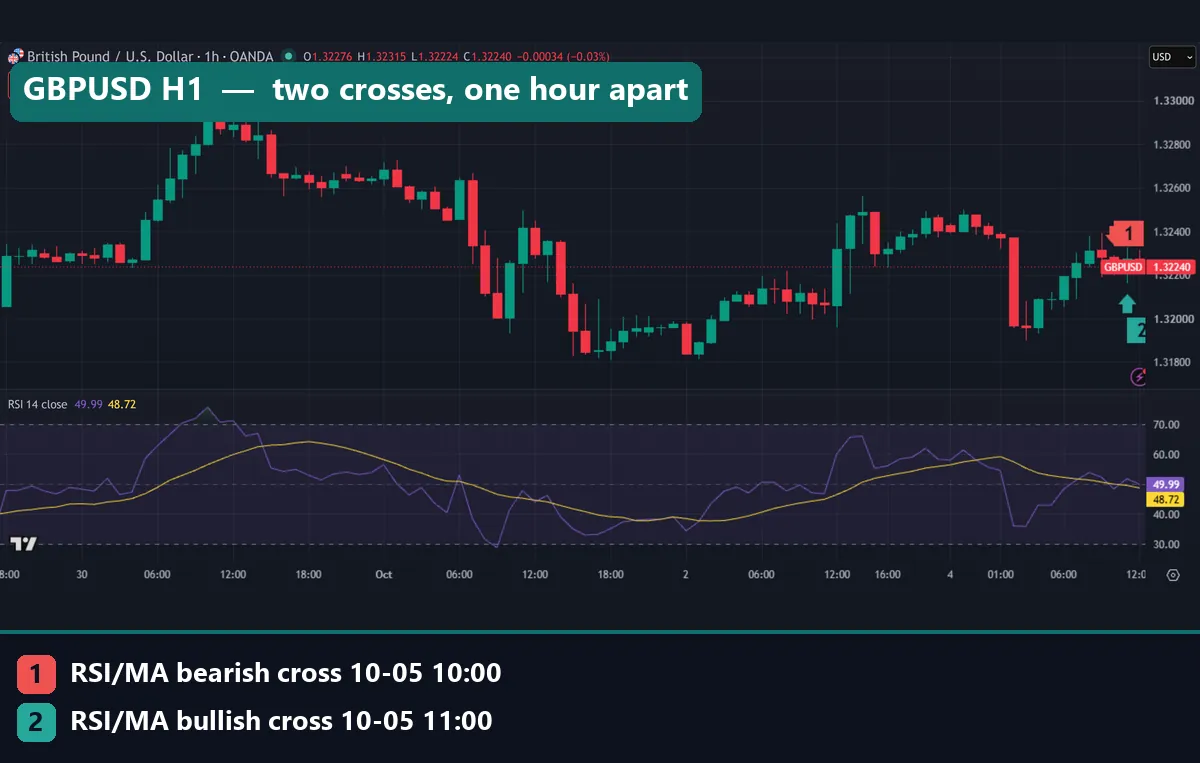
This GBPUSD one-hour chart shows two crosses one bar apart. Marker 1 is a bearish cross at 10:00 UTC on 5 October 2026. Marker 2 is a bullish cross at 11:00 UTC, one hour later. At capture, the legend read RSI 49.99 against an MA of 48.72, so the two lines were almost touching. With a gap that small, any tick can flip the cross.
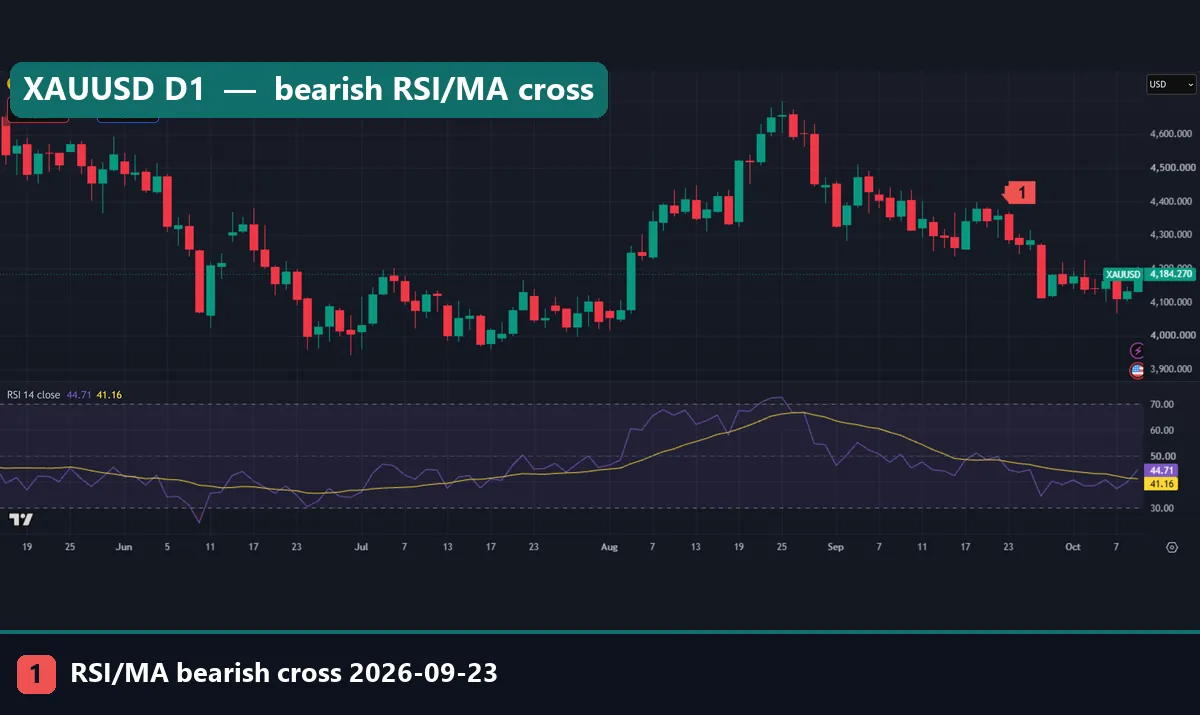
The gold daily chart shows a single bearish cross on 23 September 2026 (marker 1). Before it, RSI had hovered around the yellow line for about a week, crossing more than once. If you trade gold with RSI, our gold RSI chart guide covers how the oscillator behaves on XAUUSD.
Worked example: one month of EURUSD crosses
Here is every RSI based MA cross we logged on EURUSD daily from 21 July to 28 August 2026. The closes come from the OANDA bars in our TradingView capture.
| Date | Cross | Close |
|---|---|---|
| 21 July 2026 | Bearish | 1.13980 |
| 22 July 2026 | Bullish | 1.14120 |
| 23 July 2026 | Bearish | 1.13775 |
| 29 July 2026 | Bullish | 1.14668 |
| 28 August 2026 | Bearish | 1.15821 |
First, notice the three crosses in three days, from 21 to 23 July. A trader acting on each one would have sold, bought and sold again, with the three closes less than 35 pips apart. Each flip costs a spread, so that run would have bled money before any trend started.
Then came the 29 July bullish cross at 1.14668. This one did lead to a move. The next opposite signal, on 28 August, closed at 1.15821. That is 115 pips higher than the bullish cross close. However, price had already topped out near 1.17 a week earlier. So the bearish cross gave back much of the move before it fired.
In short, one month gave one useful signal, three whipsaws and a late exit.
What the full sample says
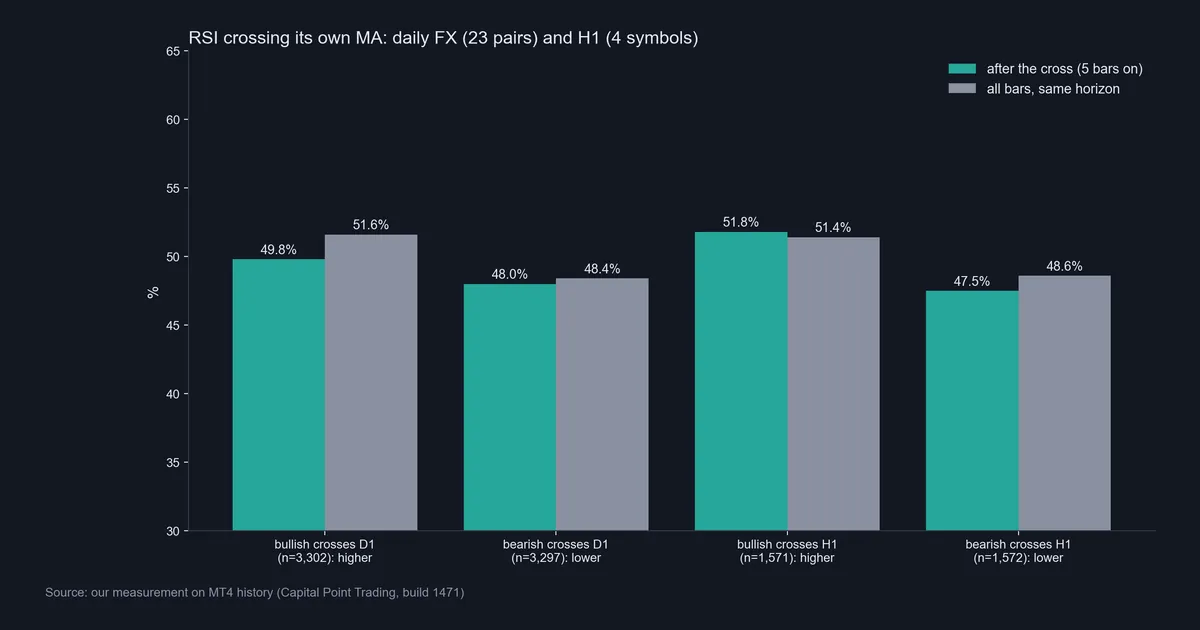
Across 23 daily pairs we logged 3,302 bullish crosses and 3,297 bearish crosses. That works out to 3.79 crosses per pair per month, or roughly one a week. Here is how they did 5 days later:
- After a bullish cross, price closed higher 49.8% of the time. On all daily bars, price closed higher 5 days later 51.6% of the time. So the bullish cross did slightly worse than a random day.
- After a bearish cross, price closed lower 48.0% of the time, against 48.4% for all bars. Again, no better than random.
The hourly test told the same story. Over 1,571 bullish crosses, price was higher 5 hours later 51.8% of the time, against a base of 51.4%. Over 1,572 bearish crosses, price was lower 47.5% of the time, against 48.6% for all hours. A gap of 0.4 points either way is noise at these sample sizes.
In our chart, each cross bar stands next to a base-rate bar of almost the same height. So on this data, the RSI based MA cross did not separate up moves from down moves. Our page on how many trades a backtest needs explains why a few thousand events can rule out a large edge.
A live hourly example
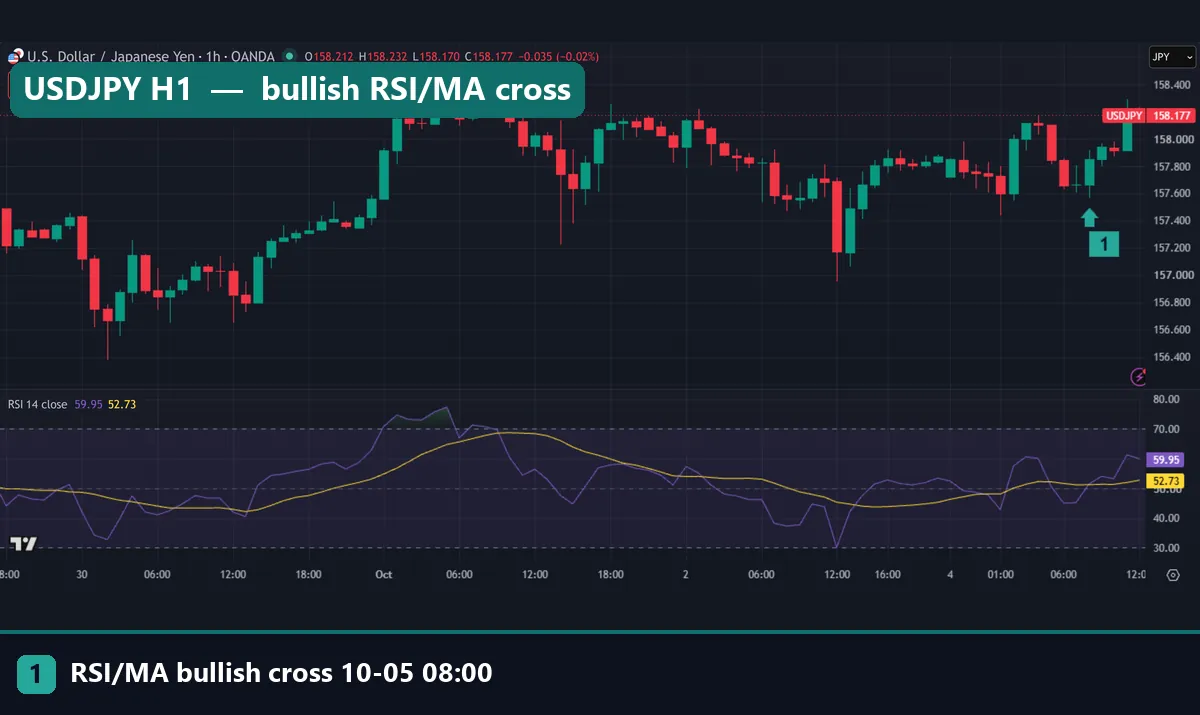
Here is a live example from the hourly sample. USDJPY printed a bullish cross at 08:00 UTC on 5 October 2026, closing at 157.854 (marker 1). By the capture, price stood at 158.177, and RSI read 59.95 above an MA of 52.73. This one moved the right way, but one good trade proves as little as one bad one.
Download the complete indicator database
Put these concepts on your charts. One email unlocks the full library of 1,380+ indicators with compiled MT4 and MT5 files, plus my TradingView scripts. No paywall, no spam, unsubscribe any time.
Get free access to my indicator database
One email unlocks 1,380+ free MT4, MT5 and TradingView indicators — the complete library. No single-tool download; you get the whole database.
Where it fails
It does not predict direction. Our 6,599 daily crosses and 3,143 hourly crosses landed within about one point of the base rate. As a result, a cross on its own gave no edge on this data before costs, and costs would push it below zero.
It whipsaws in ranges. When RSI drifts sideways near its average, the two lines cross again and again. EURUSD gave three crosses in three days in July, and GBPUSD H1 gave two in two hours. Each extra cross is an extra spread paid.
It is late by design. The MA averages 14 RSI values, and the RSI already smooths 14 bars. So the cross tends to confirm a move after it has run. On EURUSD, the bearish cross arrived about a week after the August high.
On the live bar, the RSI and its MA move with every tick. A cross can appear mid-bar and vanish at the close. Our guide to what repainting means covers why you should only judge closed bars.
Two more charts that show the limits
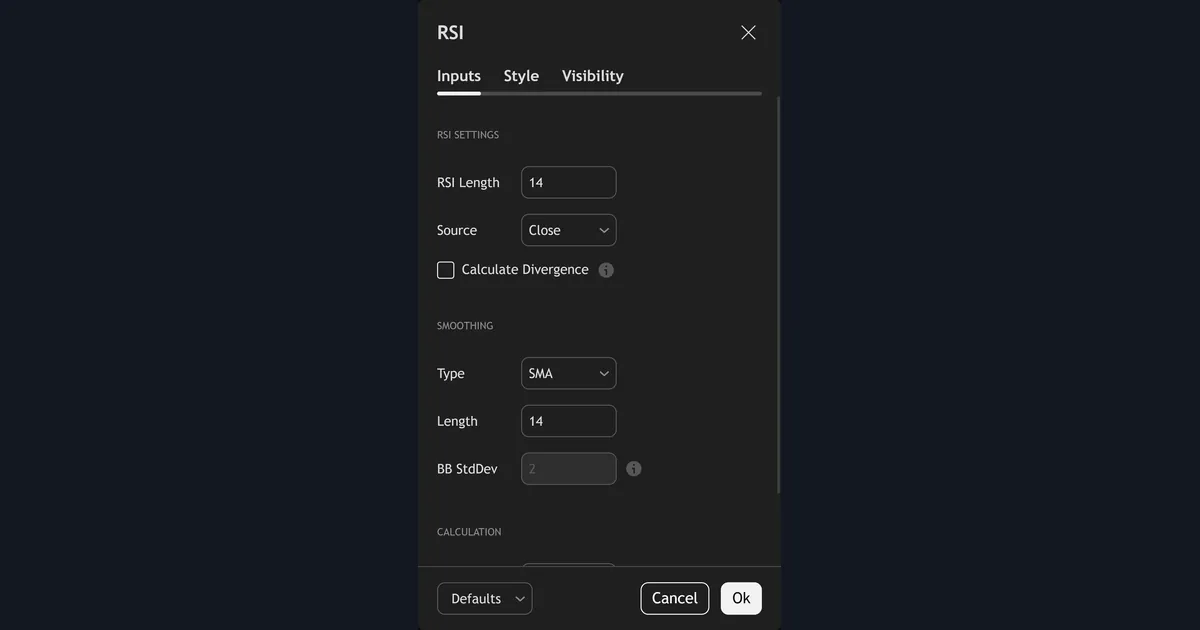
The settings dialog above is a reminder that the line is fully adjustable. That is not a strength. With enough tweaking of length and type, you can make the cross look good on any past chart. Our page on curve fitting in trading explains why a tuned setting rarely holds up on new data.
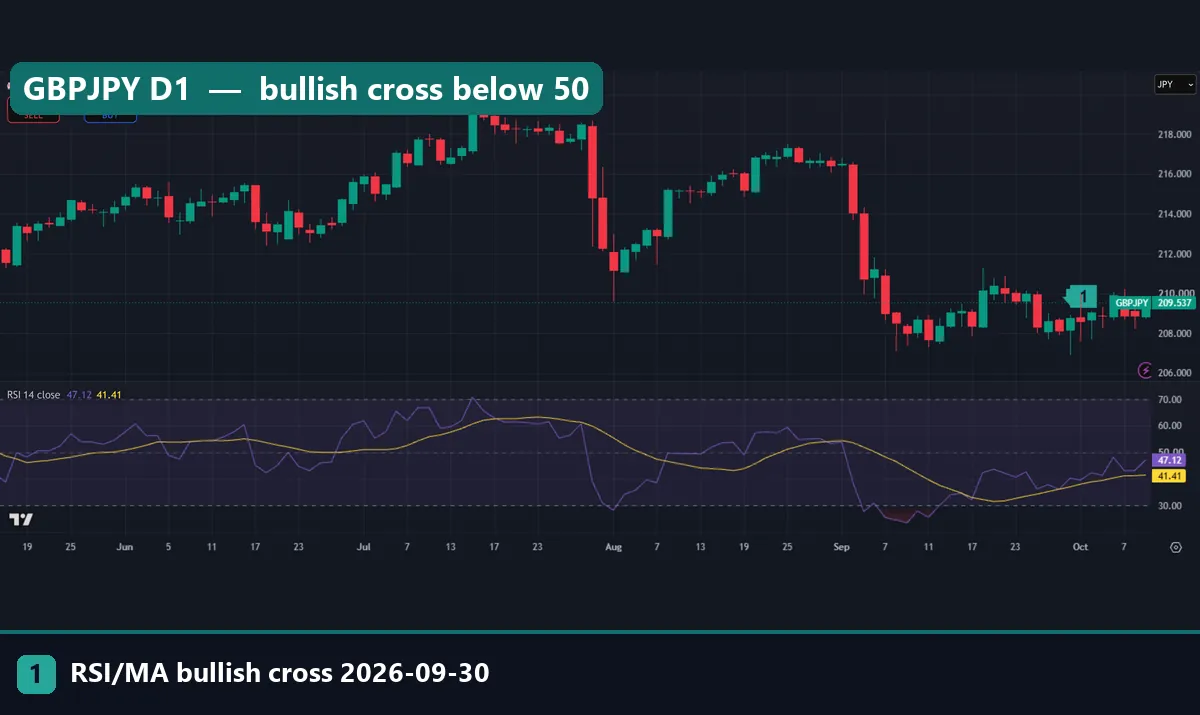
Finally, the GBPJPY daily chart shows a bullish cross on 30 September 2026, closing at 208.78, one day after a bearish cross on 29 September at 208.111. By capture, price was 209.184 with RSI at 43.24 above an MA of 39.49. Note that RSI was still under 50 here. A bullish cross deep in weak territory says only that momentum stopped falling, not that a trend has turned.
Four common mistakes with the RSI based MA
- Treating every cross as a trade. On daily FX that is about one signal a week per pair. Most of them, as our test shows, carry no information. Read our notes on why RSI gives false signals before you trust any single cross.
- Ignoring costs. Our results are before spread, swap and commission. A rule that sits at the base rate before costs loses money after them. See how transaction costs change a backtest.
- Acting on the live bar. The yellow line and the RSI both move until the close. Wait for the bar to finish, or you will act on crosses that never existed.
- Confusing it with a price average. The line averages RSI, not price. It says nothing about support, resistance or trend level. For price crosses, our moving average crossover strategy guide is the better read.
Where to go next
For more on the RSI family, read our guide to RSI buy and sell signals and the comparison of RSI and the stochastic oscillator. If you trade intraday, our page on RSI settings for day trading is a good next step. Our explainers on what overbought and oversold mean and on RSI divergence cover the classic readings.
For outside reading, the RSI article at StockCharts ChartSchool covers Wilder’s original signals in detail. If you build in MetaTrader, the iRSI function reference in the MQL5 documentation shows how to read RSI values in code, and you can then average them yourself.
FAQ
What is the RSI based MA in TradingView?
It is a moving average of the RSI line, drawn in the same pane. By default, it is a 14-bar simple moving average of RSI(14), set in the Smoothing section of the RSI settings.
What does it mean when RSI crosses above its MA?
It means the latest RSI reading is above its own 14-bar average, so recent momentum is firmer than usual. In our test of 3,302 daily bullish crosses, price was higher 5 days later 49.8% of the time, against 51.6% for all days.
Is the RSI based MA the same as a moving average of price?
No. It averages RSI values, not prices. So it cannot mark a price level, and it can cross RSI while price barely moves.
Can I change the RSI based MA from SMA to another type?
Yes. The Type dropdown in the Smoothing section lets you pick another average, and the Length field sets how many RSI values it uses. Shorter lengths cross more often; longer ones cross later.
How often does RSI cross its MA on daily charts?
On our 23 daily FX pairs, from June 2018 to August 2026, it crossed 3.79 times per pair per month on average.
Does the RSI based MA cross work better on H1?
Not in our data. On H1, bullish crosses were followed by a higher close 5 hours later 51.8% of the time, against 51.4% for all hours. Bearish crosses did slightly worse than the base rate.
Why do I see several crosses in a few bars?
Because the two lines often sit very close together. When RSI moves sideways near its average, small price changes flip it above and below the line, as on EURUSD from 21 to 23 July 2026.
Should I trade every RSI based MA cross?
Our data says a cross on its own carried no edge before costs, and costs only make it worse. If you use the line, treat it as context and test any rule on your own data first; results are not guaranteed; past performance is not indicative of future results.
Last updated: 5 October 2026.

About the author
Written by Dominic Walsh, a Forex trader and MT4/MT5 indicator, Expert Advisor and script developer. Every tool on forexmt4systems.com is tested on live charts before release and ships with ready-to-use compiled MT4 (.ex4) and MT5 (.ex5) files. Learn more about the trader and developer behind this site.
How we build, test and correct every tool: Editorial & Testing Policy. Trading carries risk; see the disclaimer.