
A seasonality chart shows how a market has behaved in each calendar month across many years. We built one for six markets from TradingView monthly closes, from 1950 for the S&P 500 to 1999 for EUR/USD. Then we asked the question most of these charts skip: did the pattern repeat? This guide settles which seasonal patterns held up in the second half of their history, which ones faded to noise, and how small the effects are.
What a seasonality chart is
A seasonality chart groups price changes by calendar month. Every January goes in one bucket, every February in the next, and so on. Then it shows one figure per bucket, such as the median change or the share of years that closed higher. Some versions draw twelve bars, and others use a heatmap like the one further down this page.
The idea comes from markets with a real yearly rhythm. Gas demand rises with winter heating, and crops follow the planting and harvest calendar. Stock indices have their own folklore too, such as a weak September. A seasonality chart turns that folklore into numbers you can check.
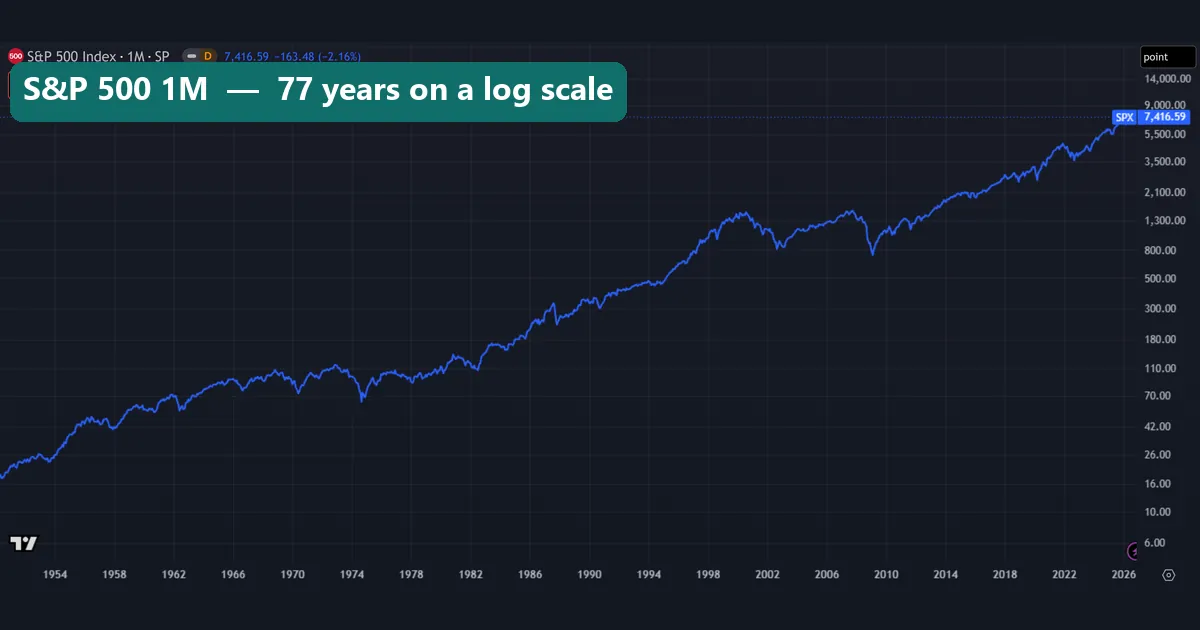
Still, it is not a forecast. The S&P 500 history above holds 922 monthly changes, yet each bucket gets only 76 or 77 of them. If indices are new to you, our guide to what stock indices are covers the basics first.
How it works: the maths behind each cell
Every cell starts with a monthly change: change = close this month / close last month - 1. Our S&P 500 chart shows one still in progress. The November 2026 bar reads 7,416.59, down 163.48 points or 2.16% from the October close. We dropped that bar, because a month only counts once it closes.
Next, we put every change into its calendar month and worked out three figures per bucket:
- Median change: the middle value, which one wild year cannot drag far.
- Share of up months: the percentage of years in which that month closed higher.
- Mean change: the plain average, which feeds the repeat test.
The repeat test matters most. We cut each history in half, computed the twelve monthly means for each half, and took the correlation between them. A score near 1 means the same months were strong or weak in both halves. A score near 0 means the first half told you nothing about the second. It is the same idea as the out-of-sample step in walk-forward analysis.
How we tested
We pulled monthly bars from the TradingView web chart on 16 and 17 November 2026. The November 2026 bars were still forming, so we left them out, and every series ends in October 2026:
- SP:SPX, the S&P 500 price index: January 1950 on, 922 monthly changes.
- TVC:GOLD: January 1975 on, after the era of a fixed gold price, 622 changes.
- NYMEX:NG1!, the front natural gas future: May 1990 on, 438 changes.
- CBOT:ZC1!, the front corn future: February 1970 on, 681 changes.
- NYMEX:CL1!, the front WTI crude future: April 1983 on, 523 changes.
- FX_IDC:EURUSD: January 1999 on, 334 changes.
We used closes only, without dividends. Each history split at its midpoint, from June 1988 for the S&P 500 to December 2012 for EUR/USD. For “sell in May”, we compared the April close with the October close, then the October close with the next April close, for 76 years from 1950. TradingView’s symbol pages also have a Seasonals view, but we did not use it. Our method follows the site’s editorial testing policy.
The settings we used
Every number here rests on these choices.
| Setting | What we used | Why |
|---|---|---|
| Bar size | Monthly (1M), closes only | One value per calendar month |
| Main figures | Median and share of up months | Outliers cannot drag them far |
| Repeat test | Correlation of 12 monthly means, first half vs second | Near 1 means the shape held |
| Split point | Middle of each history | Two halves of equal length |
| Futures series | Front month (1!) | Longest history, but it rolls |
| Sell in May | April to October vs October to April | Price index, no dividends |
The futures row matters more than it looks. TradingView’s 1! series moves to the next contract when the front one expires, and its help page on 1! and 2! continuous futures warns that rollover periods can cause sudden jumps or gaps. So our monthly changes for gas, corn and crude include those jumps. Our guide to futures contracts versus forwards explains why each contract carries its own price.
Reading the chart: natural gas, the pattern that repeated
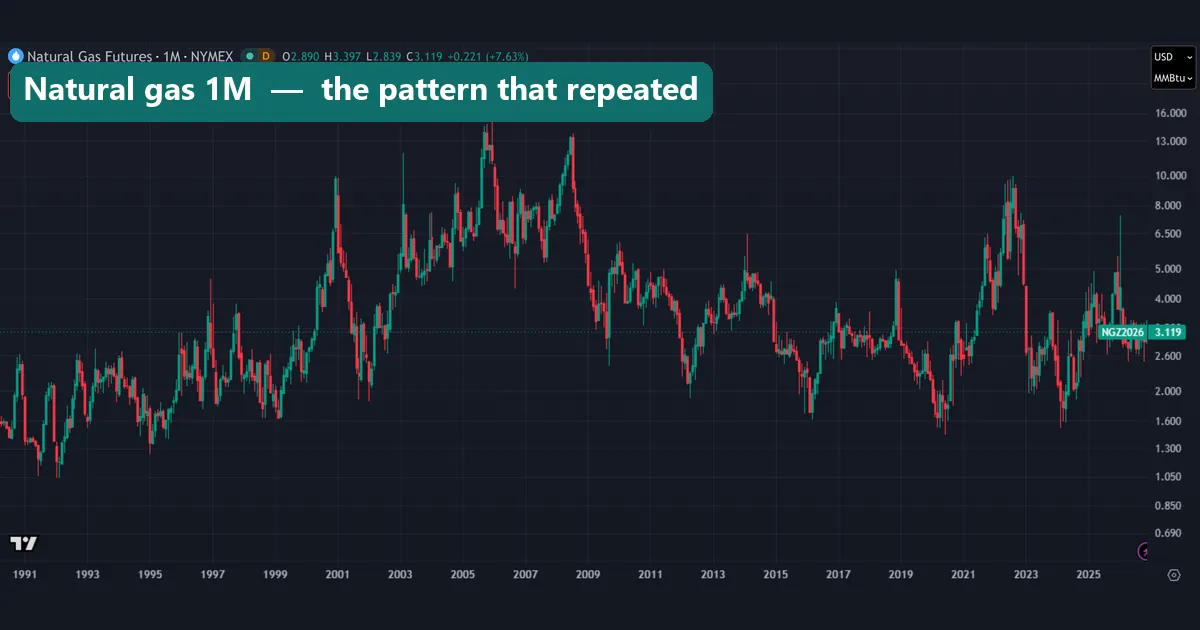
Natural gas has the clearest yearly rhythm of the six. The candles above swing from lows near 1.05 dollars per MMBtu in the early 1990s to highs above 13 in 2005 and 2008. At the right edge, the front contract is December 2026 (NGZ2026) at 3.119.
Grouped by month, the medians form a clear shape. December’s median change was -8.1% and January’s -6.1%, and each closed higher in only 13 of 36 years. Then March rose a median 5.8%, and August to October were all positive. The repeat score was 0.68, the highest in our test.
The U.S. Energy Information Administration’s page on factors affecting natural gas prices gives the background. Storage typically fills from April through October and drains from November through March, when heating demand rises. Yet our medians fall in December and January. One reason can be the roll, since each front contract prices gas for a different delivery month. In short, this chart mixes price moves with the step between contracts, and we did not separate the two.
Gold: a seasonality chart with no season
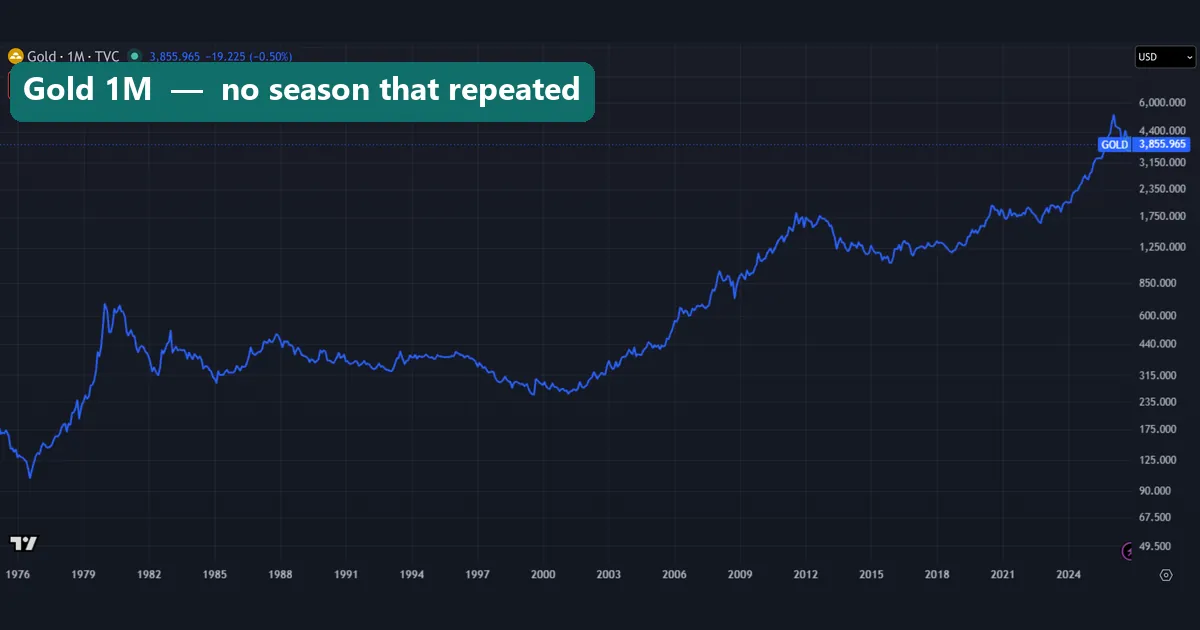
Gold is the opposite case. The line above shows the 1980 spike near 700 dollars, a long slide to about 255 around 2000, and a recent peak above the 4,400 line. The right edge reads 3,855.965 for the unfinished November 2026 bar.
On a monthly grid, gold’s medians all sit between -0.8% and +1.3%. December was the best month, and June the weakest, with only 19 of 50 Junes closing higher. That looks like a pattern, but the repeat score was 0.00. The months that were strong from 1975 to 2000 told you nothing about the years after. In plain terms, gold’s monthly profile is noise.
Also, only 51.3% of all gold months closed higher, close to a coin toss. For a related metal, see our guide to XAGUSD, silver priced in dollars.
Worked example: the S&P 500 in September
September carries the strongest folklore of any month, so we walked through it step by step:
- The bucket: 77 Septembers, from 1950 to 2026.
- Up months: 44.2%, so 34 of 77 Septembers closed higher.
- The median change: -0.35%, against a mean of -0.62%.
- The baseline: 60.4% of all 922 months closed higher.
- The repeat test: the S&P 500 profile scored 0.58.
September was the only month with a negative median, and the only one that rose in fewer than half of the years. So the folklore does have a basis in this data. December is the mirror image: it closed higher in 55 of 76 years (72.4%), with a median of +1.48%.
Now look at the size. At the 7,416.59 shown on our chart, a -0.35% month comes to about 26 index points (7,416.59 x 0.0035 = 25.96). The unfinished November 2026 bar has already moved 163.48 points. So the September tilt is small next to one month of news.
The heatmap: six markets by calendar month
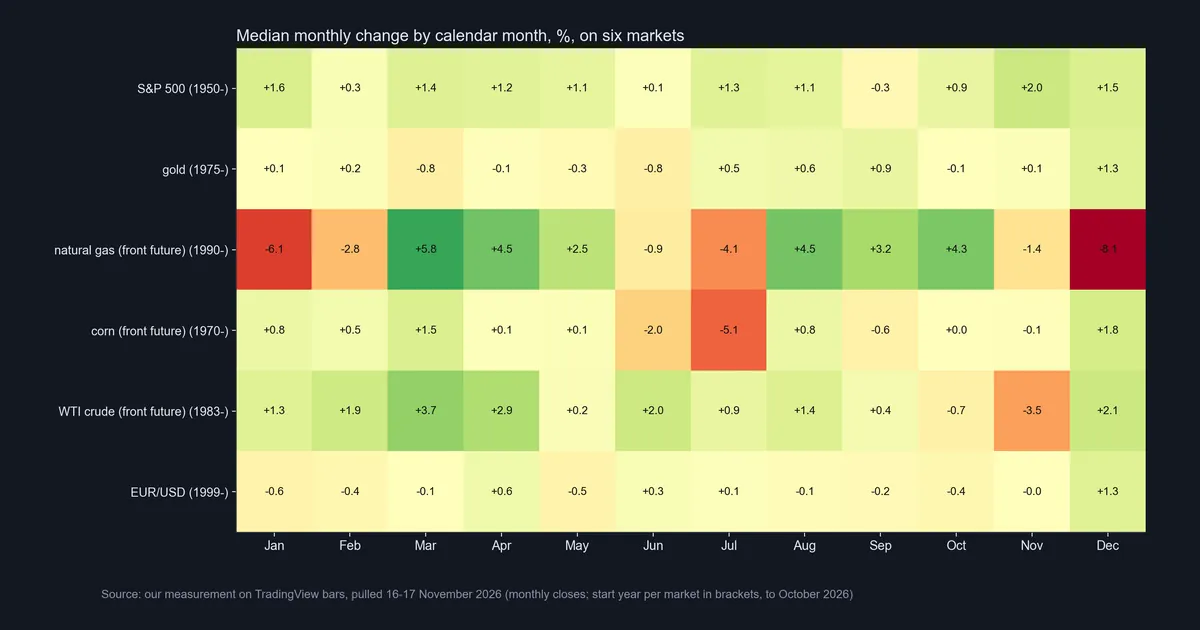
The heatmap puts all six markets on one grid, with green for positive medians and red for negative ones. The S&P 500 row is positive in eleven months, with a pale cell in September (-0.3). Gold stays pale all year. Natural gas swings from -8.1 in December to +5.8 in March. Corn’s hottest cell is July at -5.1, and crude has November at -3.5. EUR/USD is pale except for December at +1.3.
Colour shows size, not reliability. Crude’s November cell is bright, and only 15 of 43 Novembers closed higher. But crude’s whole profile scored just 0.10 on the repeat test. So a bright cell is a question, not an answer.
Does the pattern repeat? The split test and sell in May
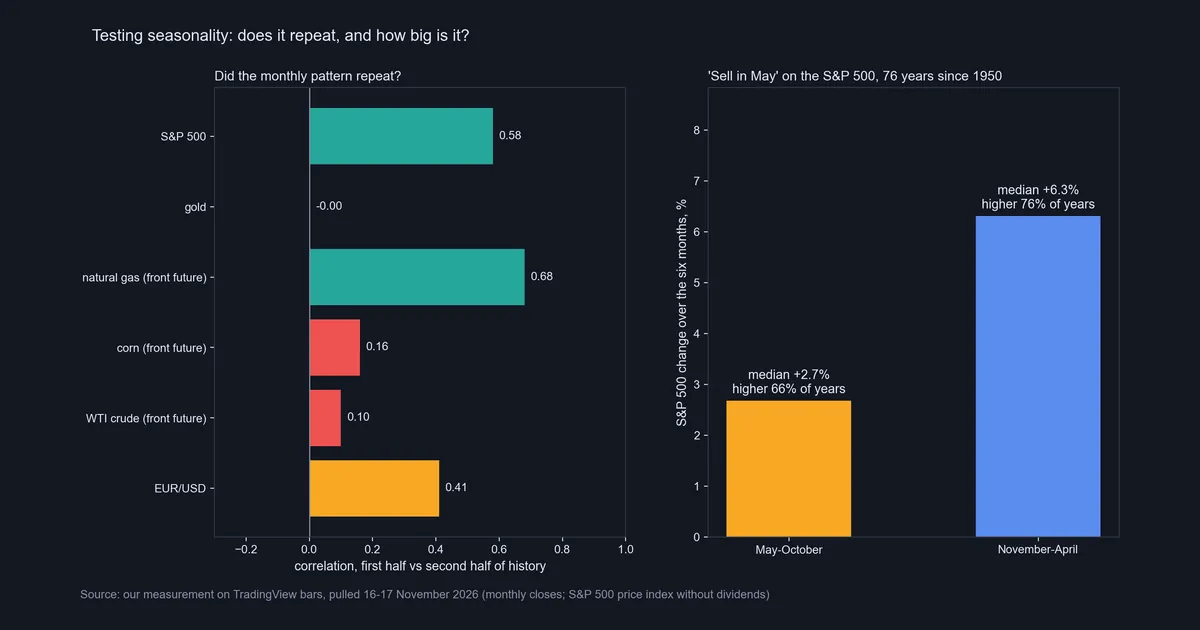
The left panel gives each market’s repeat score. Natural gas scored 0.68 and the S&P 500 0.58, while EUR/USD sat in the middle at 0.41. Corn (0.16), crude (0.10) and gold (0.00) barely repeated at all. For those three, a chart built on the full history mostly shows noise.
The right panel tests a famous saying for stocks. “Sell in May and go away” claims the November to April half beats May to October. Sven Bouman and Ben Jacobsen studied it as the Halloween indicator in the American Economic Review in 2002. On our 76 years of S&P 500 prices, November to April rose a median 6.31% and closed higher in 76.3% of years. By contrast, May to October rose a median 2.68% and closed higher in 65.8% of years.
So the winter half did better, but the summer half still rose in about two of every three years. Selling in May would have meant sitting out a median gain of 2.68%, before dividends. We read the saying as “summer is usually weaker”, not “summer usually falls”. Our guide to going long covers what holding through a weak stretch involves.
Download the complete indicator database
Put these concepts on your charts. One email unlocks the full library of 1,380+ indicators with compiled MT4 and MT5 files, plus my TradingView scripts. No paywall, no spam, unsubscribe any time.
Get free access to my indicator database
One email unlocks 1,380+ free MT4, MT5 and TradingView indicators — the complete library. No single-tool download; you get the whole database.
Where it fails
A seasonality chart sums up history, and history gets thin once you cut it into twelve pieces.
- Small buckets. Natural gas has only 36 Decembers, and EUR/USD only 27. Our page on backtest sample size explains why small counts mislead.
- Patterns fade. Gold, corn and crude scored 0.00, 0.16 and 0.10 on the repeat test.
- Averages mislead. Natural gas in September had a median of +3.16% but a mean of +10.09%, because a few huge months pull the average up.
- The roll sits in the data. A front-month change can include a contract switch that no holder earned.
- The effects are small. Costs and slippage can eat a -0.35% tilt, as our guide to backtesting with transaction costs shows.
- A vendor quote is not an official rate. Our EUR/USD series is TradingView’s FX_IDC quote. The European Central Bank’s euro reference rate for the US dollar is a separate daily series, and the two can differ.
- Price only. The S&P 500 index leaves out dividends, so it understates a holder’s total return.
Corn and EUR/USD: two weaker patterns
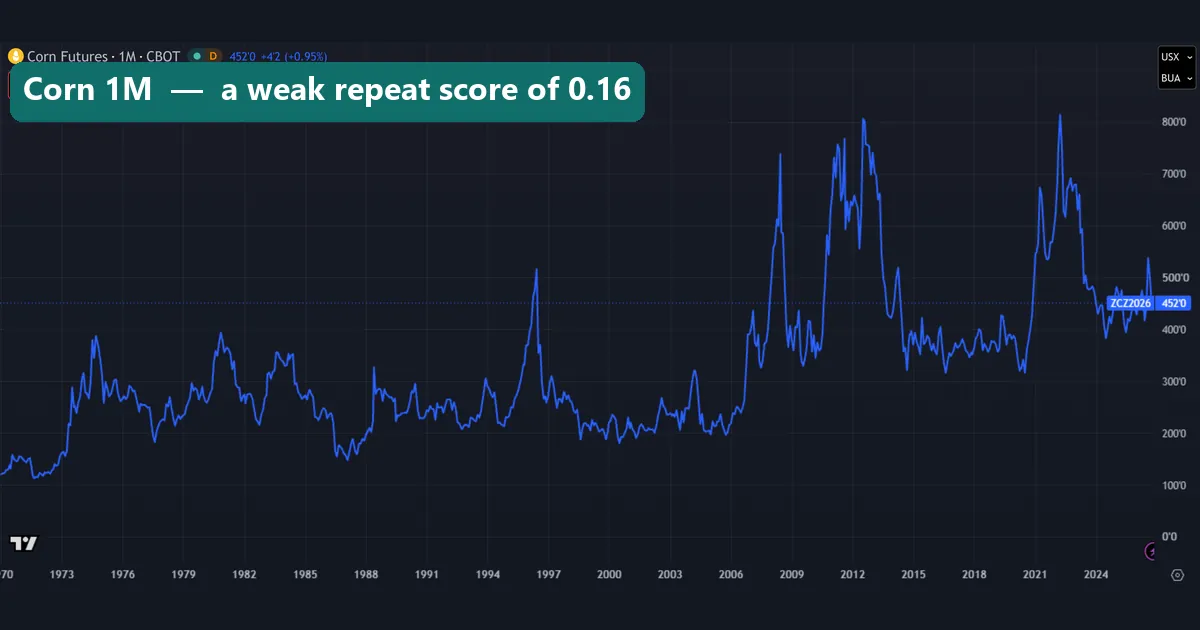
Corn shows why a strong-looking month is not enough. The front future spends decades between roughly 150 and 400 cents per bushel, then spikes in 1996, 2008, 2012 and 2022. On the monthly grid, July stands out with a median of -5.1%, and only 20 of 57 Julys closed higher. Yet corn’s whole profile scored just 0.16 on the repeat test. A neat story for July is easy to find, but the shape did not hold.
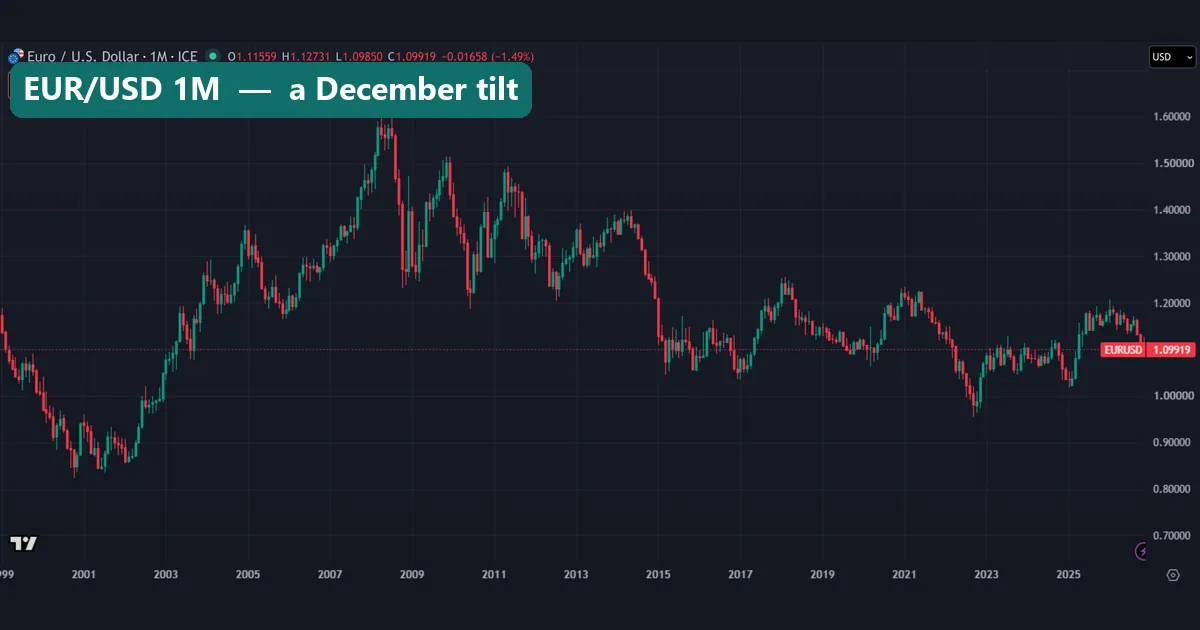
EUR/USD sits in the middle. The candles run from a low near 0.83 in 2000 to a peak near 1.60 in 2008, then dip below 1.00 in 2022. Only 48.8% of its 334 months closed higher, but December rose a median 1.27%, with 18 of 27 Decembers higher. Its repeat score of 0.41 says part of the shape carried over after 2012. For the long view, read is the euro stronger than the dollar.
Four common mistakes
- Trusting a shape without a repeat test. Gold’s chart has a best and a worst month, yet its repeat score was 0.00. Check that the shape survives in later data, or you risk curve fitting to the past.
- Plotting averages. One extreme month can swing a mean, so show the median and the share of up months.
- Ignoring the baseline. December rose in 72.4% of S&P 500 years, but all months rose 60.4% of the time. The real tilt is the gap of 12 points.
- Reading a front-month chart as spot prices. Treat the jump at a roll as a contract change, not as news. Our USOIL guide shows how the chart line, the future and a CFD differ.
Where to go next
To build your own version, start with a clean monthly chart. Our guide to the TradingView chart covers the setup. For crude, read how to invest in oil, which measures how far futures, funds and CFDs strayed from the price. And for how commodities feed into currencies, see forex and commodity correlations.
FAQ: seasonality chart
What does a seasonality chart show?
It shows how a market behaved in each calendar month over many years, usually as a median change or a share of up years. It describes the past and does not forecast the next month.
How many years of data does a seasonality chart need?
As many as you can get, because each month adds only one value per year. Even our S&P 500 series since 1950 holds just 76 or 77 values per month.
Which market had the most persistent seasonal pattern in your test?
Natural gas. Its monthly pattern from May 1990 to July 2008 matched the later years with a correlation of 0.68. The S&P 500 came next at 0.58.
Is September the worst month for the S&P 500?
In our data, yes. September had the only negative median, -0.35%, and closed higher in 34 of 77 years. The effect is small, though.
Does “sell in May and go away” work?
Partly. Since 1950 the S&P 500 rose a median 6.31% from November to April and 2.68% from May to October. The summer half was weaker, but it still rose in 65.8% of years.
Does gold have a seasonal pattern?
Not one that repeated. Gold’s split score was 0.00, so the strong and weak months of 1975 to 2000 did not carry into the years after.
Why use the median instead of the average?
Because one extreme month can drag an average. Natural gas in September had a mean of +10.09% but a median of +3.16%.
Can I trade a seasonality chart on its own?
We would not. Use it as background, check that the pattern repeats, and set your stop and size from price, not the calendar. Seasonal tilts are small and can fade, so results are not guaranteed; past performance is not indicative of future results.
Last updated: 17 November 2026.

About the author
Written by Dominic Walsh, a Forex trader and MT4/MT5 indicator, Expert Advisor and script developer. Every tool on forexmt4systems.com is tested on live charts before release and ships with ready-to-use compiled MT4 (.ex4) and MT5 (.ex5) files. Learn more about the trader and developer behind this site.
How we build, test and correct every tool: Editorial & Testing Policy. Trading carries risk; see the disclaimer.