
A day forex trading strategy is only useful if you can write it down as rules and test it. So this guide does not list twenty ideas. Instead, it takes one simple rule, the Asian-range breakout at the London open, and runs it on about 15 months of MetaTrader 4 history across five symbols. We report every result, including the losing ones, and then show how to improve and re-test a rule like this without fooling yourself.
What a day forex trading strategy actually is
A day strategy opens and closes its trades inside one session. Nothing stays open overnight. It only becomes a strategy when every decision is fixed in advance. You need a setup, an entry trigger, a stop, a target, a time exit and a cap on trades per day.
Most articles on day trading in forex describe ideas, not rules. “Trade London breakouts” is an idea. Two traders read it and take different trades, so nobody can measure it.
A written rule fixes that. For example, “buy the first 15-minute close above the night’s high” leaves no room for opinion. So you can count the trades and judge the rule.
The Asian-range breakout rule, step by step
The idea is old and popular. The Asian session is usually quiet for EURUSD and GBPUSD, so price drifts in a narrow band overnight. Then European traders arrive, volume rises, and price often leaves that band. So the rule tries to join the first clean break.
Here is the exact version we tested, in MT4 server time:
- Mark the high and low of all 15-minute bars from 00:00 to 06:59. That is the Asian range.
- From 07:00 to 11:59, wait for the first M15 bar that closes above the high or below the low.
- Enter at that close, in the direction of the break. Only one trade per day.
- Put the stop at the other side of the range.
- Set the target at the same distance as the stop, so the reward is 1R.
- If neither level is hit, exit at the open of the 20:00 bar.
The formula for the risk is plain: 1R = |entry close - opposite side of the range|. Then the target is entry + 1R for a buy and entry - 1R for a sell. Because every trade risks exactly 1R, results add up in R units, so pairs with very different prices compare cleanly. If no bar closes outside the range before noon, there is no trade that day.
How we tested the rule
We ran the rule in a Python script over 15-minute candles exported from the site owner’s terminal: Capital Point Trading MetaTrader 4, build 1471. The symbols were EURUSD, GBPUSD, USDJPY, EURJPY and XAUUSD (gold). The history runs from June 2025 to August 2026. However, the depth of M15 history differs by symbol on this broker, so the sample windows are not equal. EURUSD covered 300 trading days, while EURJPY covered only 22.
MT4 server time on this broker is UTC+3 in summer and UTC+2 in winter. So in summer the range window runs from 21:00 to 03:59 UTC, entries run from 04:00 to 08:59 UTC, and the time exit falls at 17:00 UTC. The rule simply follows the server clock.
Two limits matter. First, the script does not subtract spread or commission, so every figure is gross. Second, it tests bars, not ticks. When a single bar touched both the stop and the target, the script counted the stop first, which is the cautious choice.
The chart images come from the TradingView web chart on OANDA data, captured on 1 October 2026. They sit outside the test window on a different feed, so treat them as illustrations, not test trades. Our full method is in the editorial testing policy.
The rule’s parameters in one table
Change any value and you have a new rule that needs its own test.
| Parameter | Value we tested | Why it matters |
|---|---|---|
| Timeframe | M15 | Sets how fast a break is confirmed |
| Range window | Server 00:00 to 06:59 | Defines the quiet band to break |
| Entry window | Server 07:00 to 11:59 | Limits trades to the European morning |
| Trigger | First M15 close outside the range | A close, not a wick, starts the trade |
| Stop | Opposite side of the range | Wider ranges mean wider stops |
| Target | 1R | Needs more targets than stops to profit |
| Time exit | Server 20:00 bar open | Keeps it a true day trade |
| Trades per day | One | Stops the rule from chasing a second break |
| Costs | Not deducted | Real results will be worse |
Note the target row. With equal stop and target, the rule needs more targets than stops just to break even before costs.
Reading the Asian range on a chart
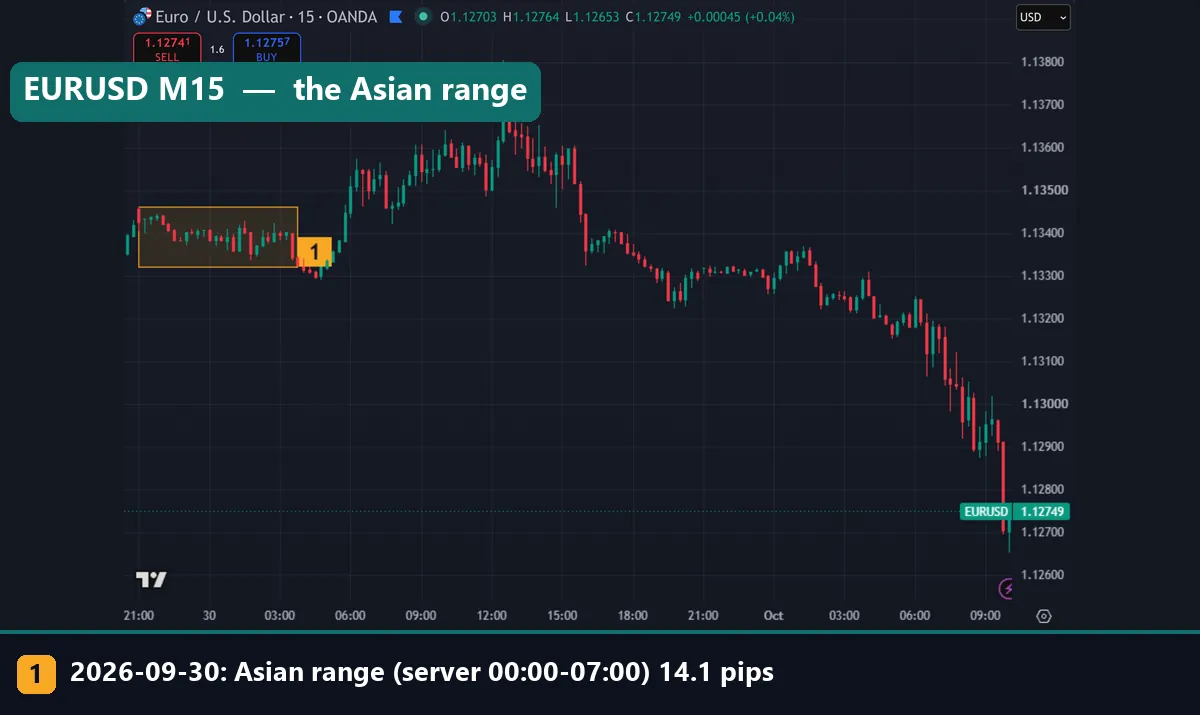
The first image shows EURUSD M15 with the most recent Asian range boxed. On 30 September 2026 the range measured 14.1 pips. The next two images repeat the same box for GBPUSD and gold.
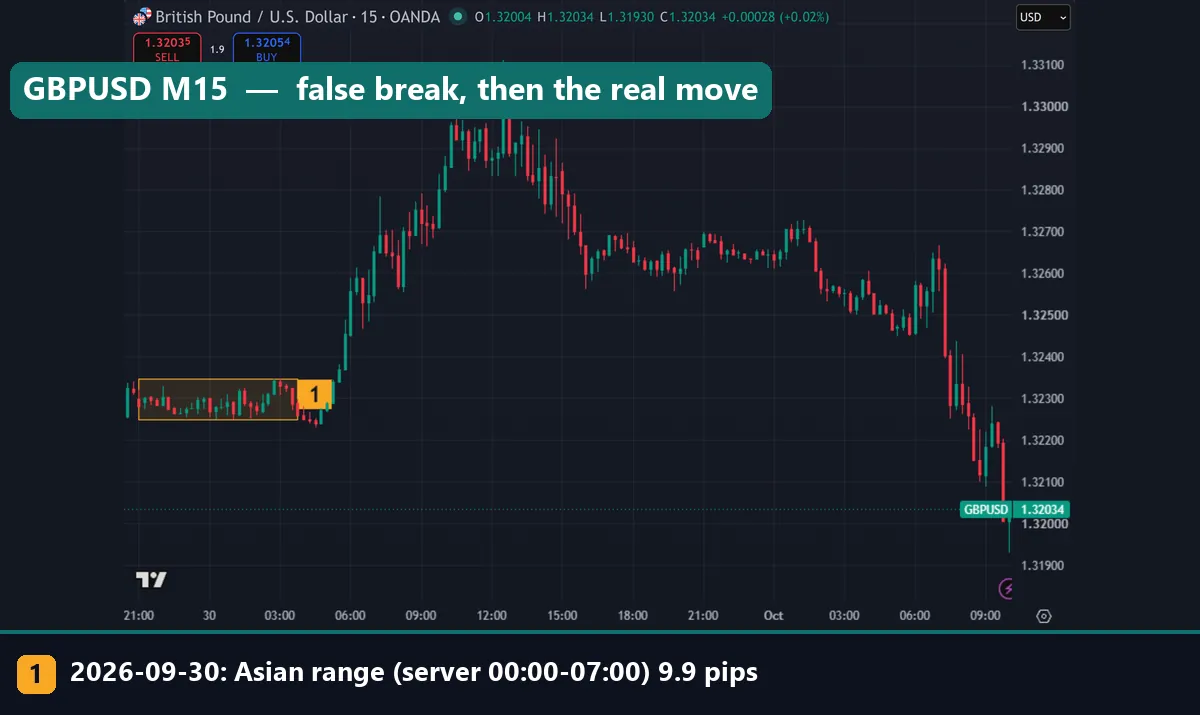
On GBPUSD the box was only 9.9 pips tall. Both pairs first closed a few bars below the box. Under our rule, that is a sell. Then the European morning pushed both pairs sharply higher, through the top of the box and well beyond it. So a short taken on that first close would have hit its stop at the top of the range.
One day proves nothing. Still, it shows how this rule usually loses: an early false break, then a strong move the other way.
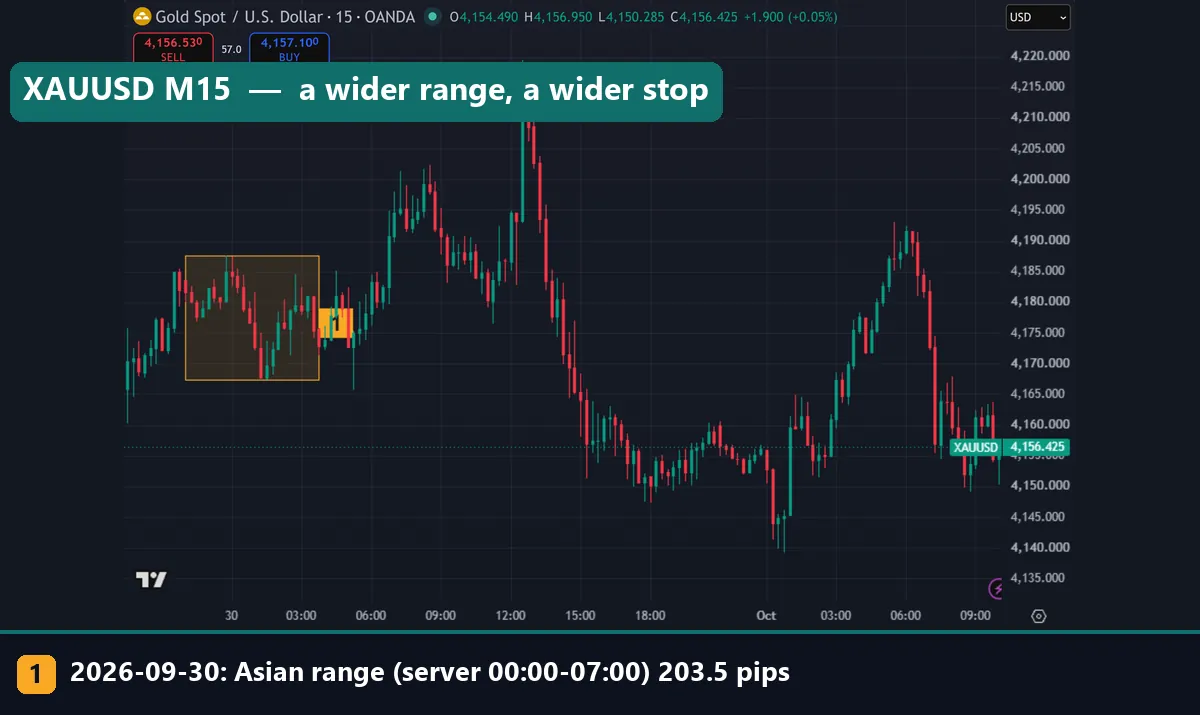
Gold looks different. Its range was 203.5 pips in the 0.1-dollar pip unit our script uses, and price sat near the box for a while before rising toward 4,200. Wider ranges also mean wider stops. That matters, because the stop sets the size of 1R and therefore your position size.
Worked example: the day forex trading strategy results
Here are all five results, before spread and commission.
- EURUSD: 244 trades, net -10.39R, average -0.043R per trade. Median Asian range 22.1 pips.
- GBPUSD: 198 trades, net -5.33R, average -0.027R. Median range 24.9 pips.
- USDJPY: 68 trades, net -7.71R, average -0.113R. Median range 32.5 pips.
- EURJPY: 13 trades, net -3.63R, average -0.279R. Median range 32.7 pips.
- XAUUSD: 189 trades, net +23.57R, average +0.125R. Median range 372.3 pips.
Take EURUSD as the worked case. The script scanned 300 days and found a trade on 244 of them. Of those, 87 reached the 1R target and 100 hit the stop. The other 57 closed at the 20:00 time exit. Time exits clawed a little back, but the total still ended at -10.39R.
Now add costs. On a median EURUSD day the stop is at least 22.1 pips away. So every pip of round-trip cost removes roughly 0.045R from each trade. In other words, one pip of cost would roughly double the average loss. The rule as written is not an edge on the FX majors in this window.
Gold is the exception, and it deserves caution. The same arithmetic says gold’s +0.125R average would vanish at a round-trip cost of roughly 46 pips on a median-range day. Also, that profit comes from one 15-month window on one broker’s data. For a sense of how many trades it takes to trust a number, see our page on backtest sample size.
How the trades ended
The next two charts are our own drawings of the measured results, not platform screenshots.
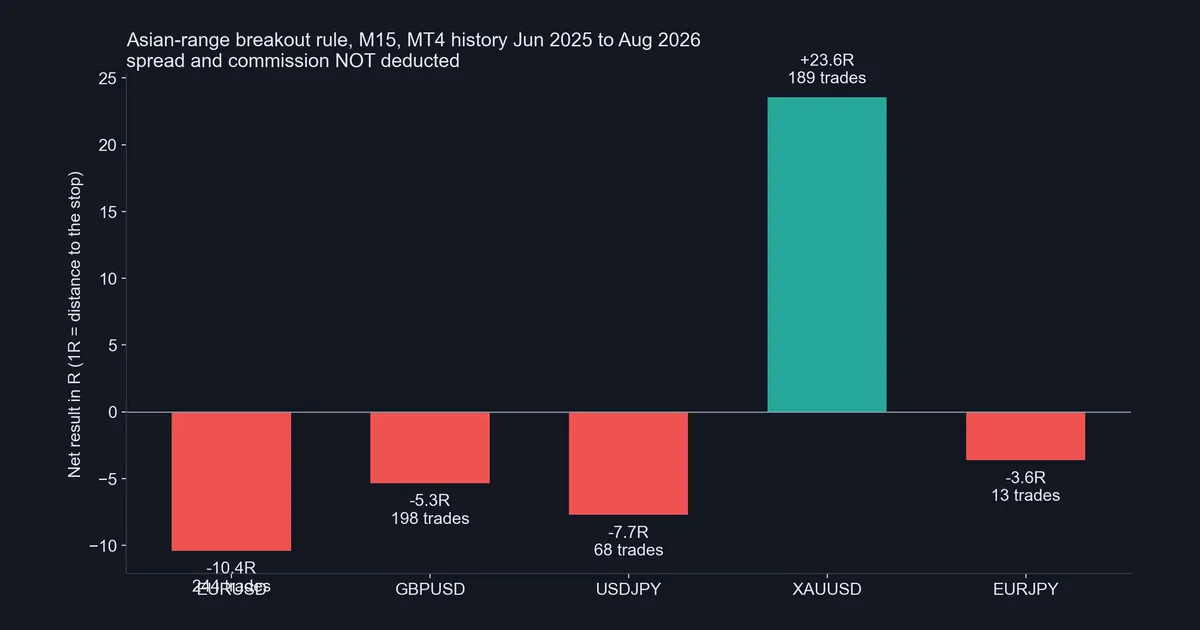
Four symbols sit below zero and only gold sits above it. EURJPY rests on just 13 trades, far too few to read.
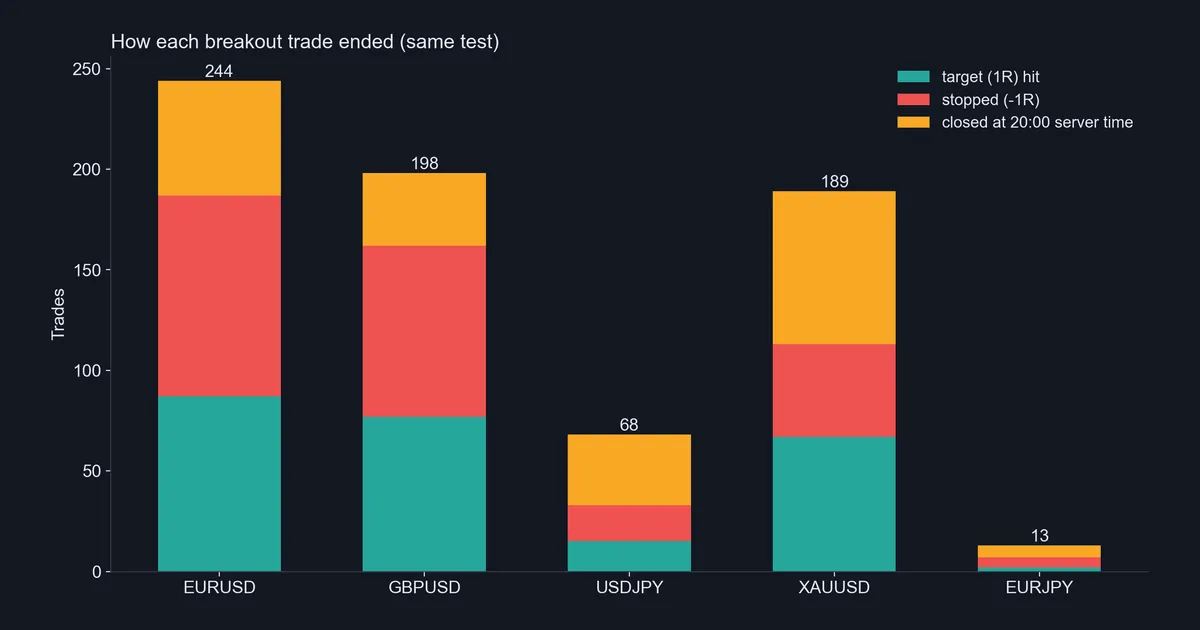
This chart splits each symbol’s trades into target hits, stops and 20:00 exits. On EURUSD and GBPUSD, stops beat targets: 100 to 87 and 85 to 77. On USDJPY the stops led 18 to 15, but most trades, 35 of 68, ran out of time. Gold had the opposite shape. It hit 67 targets against 46 stops, and 76 trades closed at the time exit. In short, gold’s breaks tended to keep going; the majors’ breaks tended to fail. For how to turn those counts into a single figure, read our guide to trading expectancy.
Download the complete indicator database
Put these concepts on your charts. One email unlocks the full library of 1,380+ indicators with compiled MT4 and MT5 files, plus my TradingView scripts. No paywall, no spam, unsubscribe any time.
Get free access to my indicator database
One email unlocks 1,380+ free MT4, MT5 and TradingView indicators — the complete library. No single-tool download; you get the whole database.
Where it fails
It enters before London. In summer the entry window opens at 04:00 UTC, three hours before the London cash open. So many triggers fire in thin early trade, as on the 30 September charts.
It ignores costs. Our figures are gross. On a 22-pip median range, normal spreads alone take a visible slice of each trade. Our page on backtesting transaction costs shows how to add them properly.
The stop size is random. The range sets the stop, not the trader. A narrow night and a wide night produce very different trades, yet the rule treats them alike.
It has no trend or news filter. It buys and sells breaks equally, on every weekday, through every data release.
The samples are uneven. EURJPY had 22 days of M15 history and USDJPY had 101. Those two results say very little either way.
One window, one feed. Every result comes from one broker’s history over about 15 months. A different broker’s server clock would also move the range window itself.
Volatility and the session clock
A breakout rule depends on how much the market moves, and that changes by the hour.
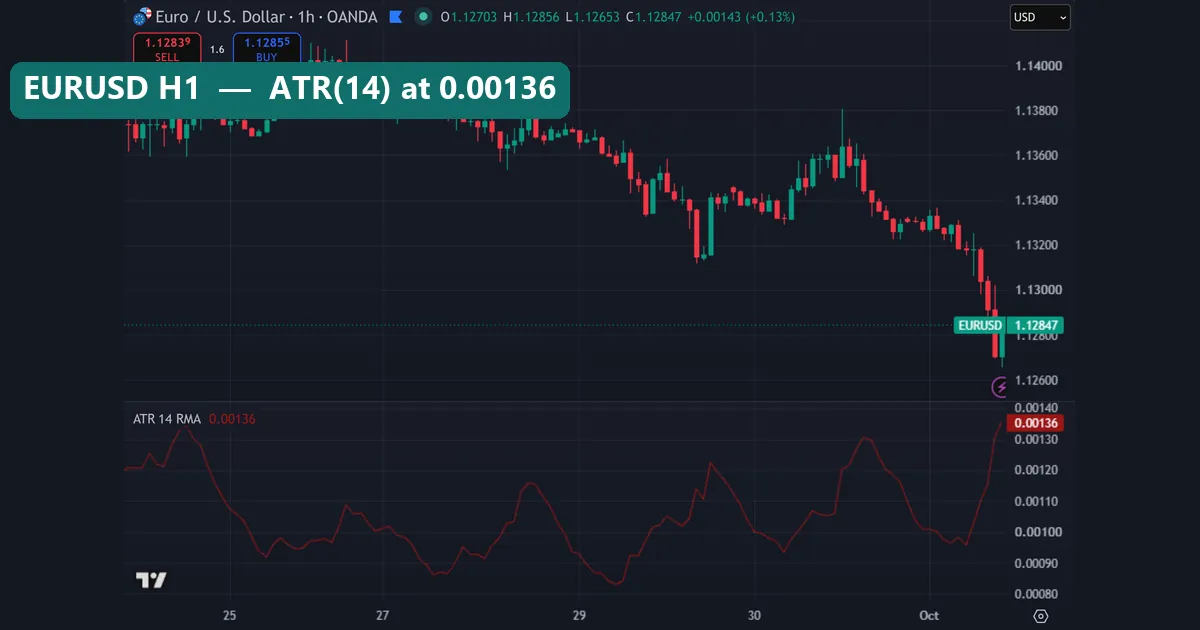
On EURUSD H1, the Average True Range (14, RMA) read 0.00136 on the last bar, about 13.6 pips. Over the week it swung between roughly 0.0008 and 0.0014. So the 14.1-pip Asian range on 30 September was close to a single hour’s normal movement. A range that small breaks easily in either direction. If ATR is new to you, start with what ATR is in trading, then read how to use ATR for day trading. TradingView also documents the calculation in its ATR help article on TradingView.
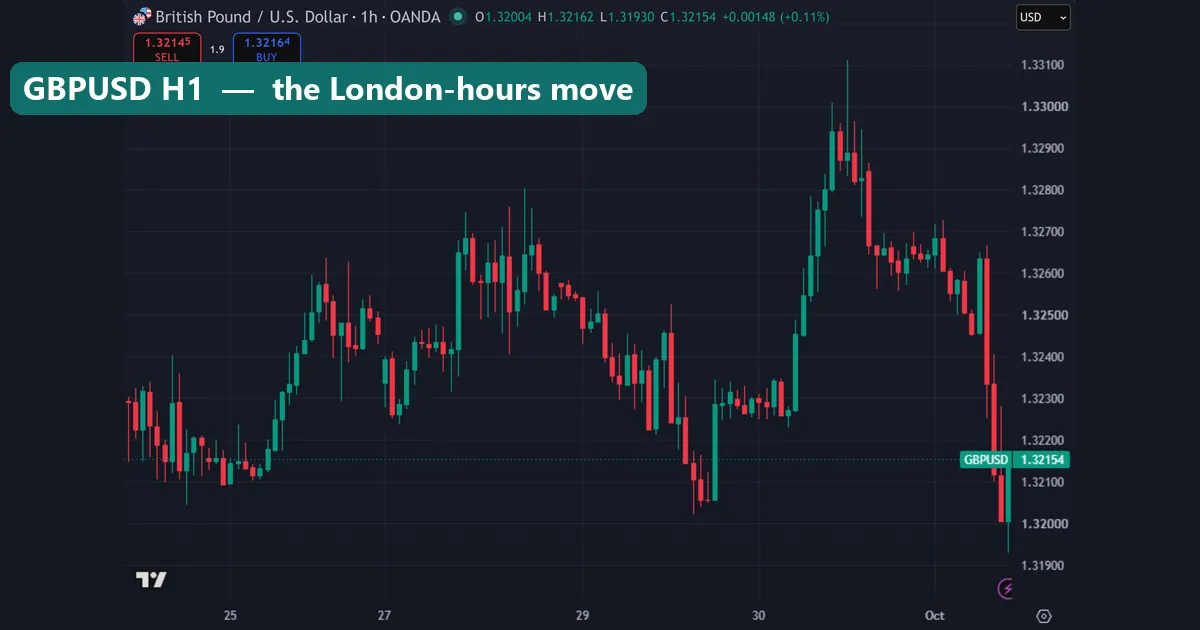
GBPUSD H1 shows the same week without an indicator. On 30 September the pound climbed hard during the European morning, from below 1.3240 to above 1.3300. Our guides to the Asian trading session and the London trading session explain why activity shifts at these hours. The BIS Triennial FX Survey on bis.org shows how much turnover runs through London.
How to improve and re-test a day strategy
A losing first test is useful. It tells you what the base rule does, so each change can be measured against it. Work in this order.
- Add costs first. Subtract your real spread and commission from every trade. If the base rule loses before costs, it will lose more after them.
- Change one thing at a time. For example, start the entry window at the London open, or skip days when the range is very small next to ATR. Test each change alone.
- Write the filter before you look. Pick the threshold from reasoning, not from the results. Otherwise you are fitting the past. Our page on curve fitting in trading shows the warning signs.
- Hold data back. Tune on one part of the history, then run the final rule once on months you never touched. A walk-forward analysis repeats that split many times.
- Forward test. Run the rule on a demo account for several months. Our page on what forward testing is covers the method.
None of these steps makes a rule profitable; they make the answer honest. The article on backtesting on Wikipedia gives a neutral overview of the limits of any historical test.
Common mistakes when testing a day strategy
1. Testing only the pair that worked. If we had shown only gold, the rule would look good. Report every symbol you ran, or the result means nothing.
2. Forgetting the server clock. Session rules depend on time. Your broker’s chart may sit on UTC+2, UTC+3 or something else, and daylight saving shifts it twice a year. So check where midnight falls before you mark a range.
3. Sizing by pips instead of by risk. A fixed lot on a narrow stop and on a wide stop carries very different risk. Instead, size each trade so 1R equals a fixed share of the account. Our guides to risk per trade and position sizing show how.
4. Trusting a small sample. Thirteen EURJPY trades cannot separate skill from noise. Even 189 gold trades in one window leave room for luck.
Where to go next
If you want to build your own test, start with our step-by-step guide on how to backtest a trading strategy. Then use the overview of forex trading sessions to set your own windows. For a smart-money take on the same night range, see the ICT Asian range strategy. Finally, keep losses contained with our risk management in forex guide.
For outside reading, the breakout trading entry at BabyPips describes the general idea in plain terms.
FAQ
What is the best day forex trading strategy?
No single rule suits every market. The useful question is whether a written rule holds up after costs on unseen data. Our test shows a popular idea failing that check.
Does the Asian-range breakout work?
Not on the FX majors in our test. EURUSD, GBPUSD, USDJPY and EURJPY all lost before costs from June 2025 to August 2026. Gold made +23.57R before costs, but that is one window on one broker’s data.
What time does the Asian range start and end?
In our test it ran from 00:00 to 06:59 server time. On this broker that is 21:00 to 03:59 UTC in summer and one hour later in winter.
Why measure results in R instead of pips?
R is the distance to the stop. Measuring in R lets you compare EURUSD with gold, and it shows results as multiples of the risk you took.
Why did gold behave differently from the majors?
Gold’s breaks reached the 1R target 67 times against 46 stops in this window. A longer history and costs would be needed before reading anything into it.
How many trades do I need before trusting a backtest?
A few dozen trades say very little. Hundreds of trades across different conditions, plus an out-of-sample check, give a firmer base.
Should I add an ATR filter to the rule?
It is worth testing, for example skipping very small ranges. We did not test it, so we cannot say whether it helps.
Can I trade this rule live?
You can, but our test gives no reason to expect a profit on the majors. Forward test on a demo account first. Trading carries real risk of loss, and results are not guaranteed; past performance is not indicative of future results.
Last updated: 1 October 2026.

About the author
Written by Dominic Walsh, a Forex trader and MT4/MT5 indicator, Expert Advisor and script developer. Every tool on forexmt4systems.com is tested on live charts before release and ships with ready-to-use compiled MT4 (.ex4) and MT5 (.ex5) files. Learn more about the trader and developer behind this site.
How we build, test and correct every tool: Editorial & Testing Policy. Trading carries risk; see the disclaimer.