
Momentum scalping means jumping on a short, fast burst of price and riding it for a few minutes. We wanted to know if that idea holds up once you write it as a fixed rule. So we tested one plain version on 15-minute charts of nine symbols over fourteen months, 4,934 trades in all. This guide settles three things: what a momentum burst is, what the rule did before costs, and why costs decide the outcome. The short answer is that the average trade made or lost a fraction of a pip on most pairs.
What momentum scalping is
Momentum scalping is a short-term style that buys after a strong up move and sells after a strong down move. The bet is that a bar which moves far and closes near its extreme may carry on a little longer.
Many scalpers fade moves or trade ranges. A momentum scalper does the opposite and trades with the push. Our guide to scalping in forex covers the wider family. If you are still choosing a style, the page on scalping vs day trading compares holding times and costs.
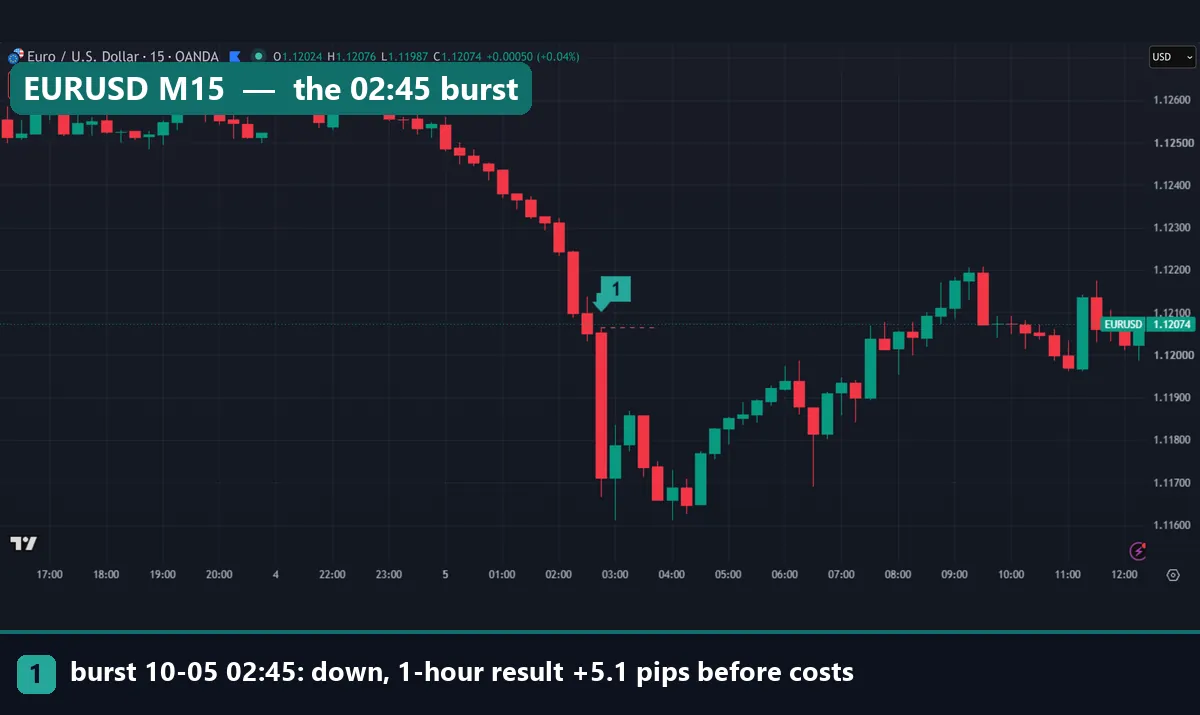
The image above shows the idea on EURUSD M15. Price slid for hours, then one large red bar broke lower on the morning of 5 October 2026. That bar is the kind of burst this method looks for.
How a momentum burst works
A burst needs size and a strong close. A big bar with long wicks shows a fight, not a push, so our rule checks both.
First, size. We compare the bar’s body with the average true range of the last 14 bars:
Body = |Close - Open| and the bar qualifies when Body >= 1.5 x ATR(14).
Next, the close. We measure where the close sits inside the bar’s range:
Close location = (Close - Low) / (High - Low)
An up burst needs a close location of 0.8 or more. A down burst needs 0.2 or less. In plain words, the close must sit in the outer 20% of the bar, on the side of the move.
ATR is the yardstick here, so it helps to know it well. Our explainer on what ATR is in trading covers the basics. TradingView describes its version in the Average True Range help page at TradingView. In MT4 the same measure comes from the iATR function, which the iATR reference in the MQL4 documentation lists. Note that the two platforms do not smooth true range in exactly the same way, so ATR values can differ a little.
A burst bar often looks like a marubozu candlestick: a full body with little or no wick on the closing side.
How we tested momentum scalping on M15
We read 15-minute history from a MetaTrader 4 terminal (Capital Point Trading, MetaTrader 4, build 1471). The window ran from 2 June 2025 to 26 August 2026. It covered nine symbols: AUDCAD, AUDUSD, EURUSD, GBPUSD, NZDCAD, USDCAD, USDCHF, USDJPY and XAUUSD.
The rule was fixed before we looked at results. Find a burst bar. Enter at the next bar’s open in the burst direction. Place the stop at the far end of the burst bar. Then exit at the close one hour later, four M15 bars on, unless the stop hits first. Only one trade runs at a time.
One limit matters a lot. The MT4 history on this terminal does not store usable spreads. So every result here is before spread, swap and commission. Gold figures appear in dollars, because one gold “pip” in these files is a $0.10 step.
The chart images come from the TradingView web chart with OANDA data, captured on 5 October 2026. Times are UTC. The two bar charts are our measurement from the MT4 files. Our methods are set out in the editorial testing policy.
The rule’s parameters
The table lists every input, so you can copy the test.
| Parameter | Value in our test | What it controls |
|---|---|---|
| Chart timeframe | M15 | Bar size used to find bursts |
| ATR length | 14 bars | The yardstick for a “big” bar |
| Body threshold | 1.5 x ATR(14) | How large the body must be |
| Close location | Outer 20% of the range | How strong the close must be |
| Entry | Next bar’s open | No entry inside the burst bar |
| Stop loss | Far end of the burst bar | Low for longs, high for shorts |
| Exit | Close 4 bars later (1 hour) | Fixed time exit, no target |
| Open trades | One at a time | No stacking on the same symbol |
We did not tune these values. Tuning on the same data tends to produce a rule that fits the past and nothing else, a trap our page on curve fitting in trading explains.
Reading a burst on the chart
On a live chart, a burst is one bar that dwarfs the bars before it. Still, it only qualifies once the bar closes.
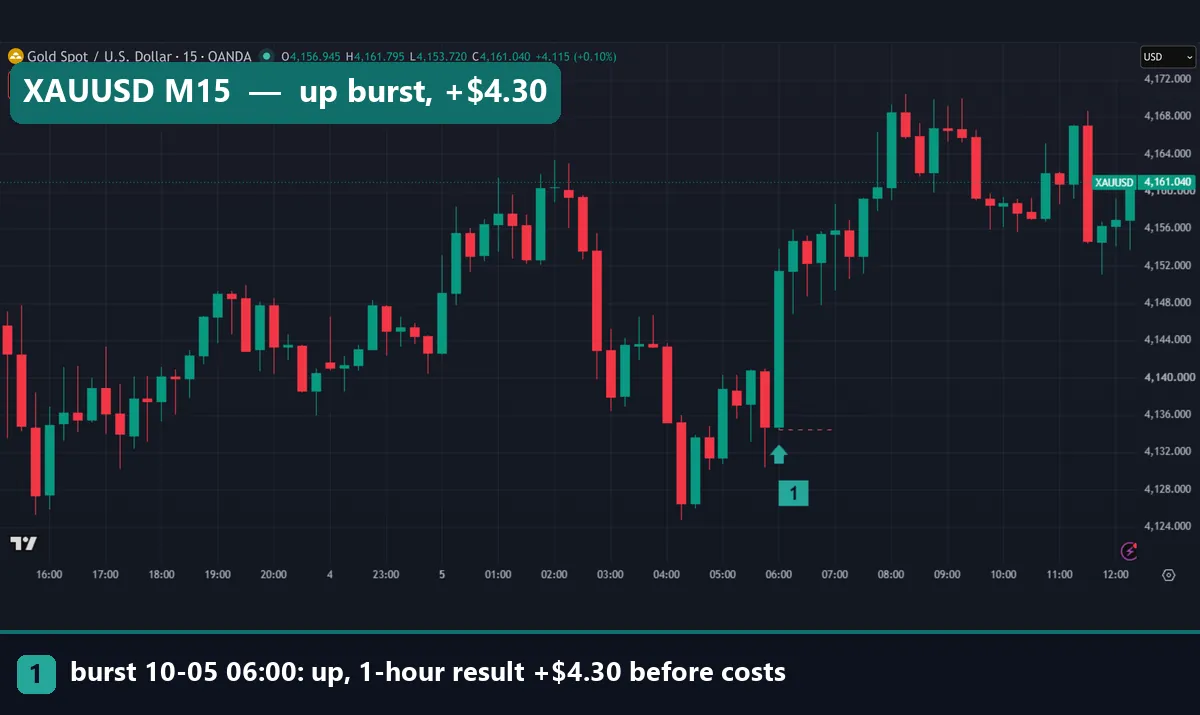
The gold chart above shows an up burst at 06:00 UTC on 5 October 2026. The bar opened at $4,134.70 and closed at $4,151.49, close to its high of $4,153.83. The red dashed line marks the stop at the bar’s low, $4,134.415. Entry came at the next open, $4,151.475. One hour later price closed at $4,155.77, a gain of $4.30 before costs.
But the stop sat $17.06 away, so the trade risked about four times what it made. Our guide to gold pip value shows how such dollar moves turn into account money.
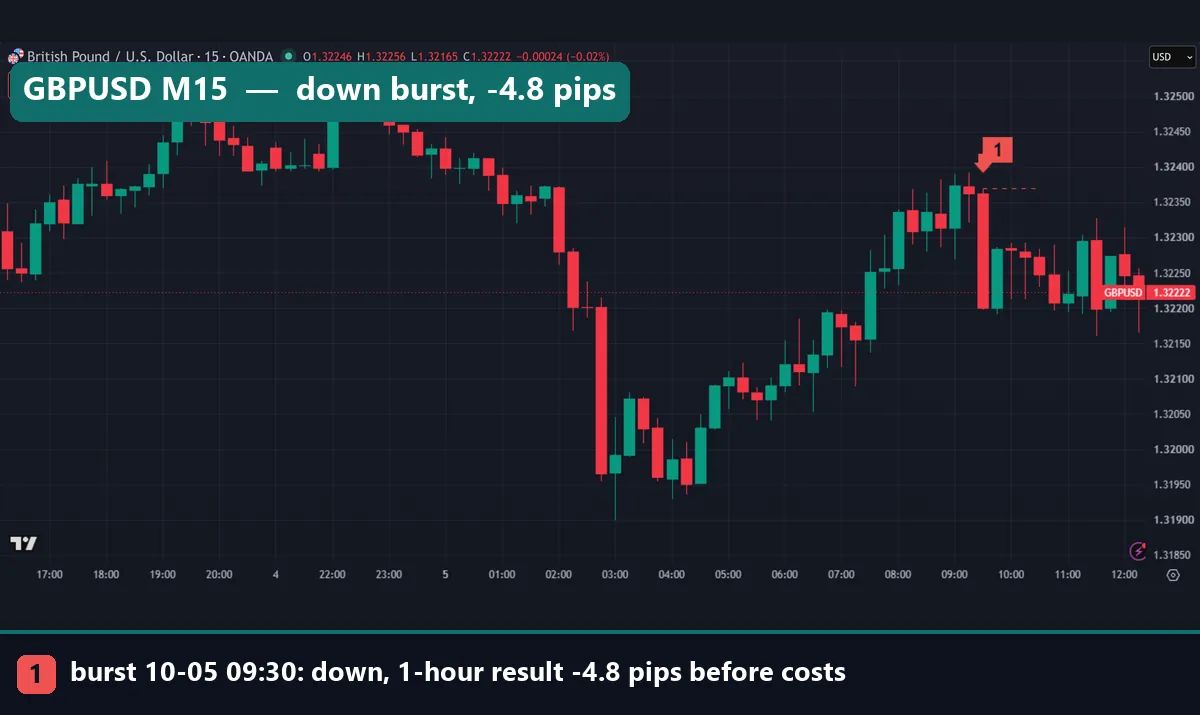
The GBPUSD chart shows the other side. A down burst closed at 09:30 UTC the same morning. The bar ran from 1.32362 to 1.32200, almost exactly at its low of 1.32198. Entry came at 1.32200, with the stop 17 pips higher at the bar’s high of 1.32370. However, price drifted back up. The time exit closed the trade at 1.32248, a loss of 4.8 pips before costs. The stop never hit; the move simply stalled.
Worked example: the EURUSD drop on 5 October
Go back to the first image. EURUSD fell through the Asian session on 5 October 2026, and two bars met the burst rule.
The first came at 02:15 UTC. It opened at 1.12244 and closed at 1.12098. Entry at the next open was 1.12098, and the one-hour exit came at 1.11858. That trade made 24.0 pips before costs.
The second is the marked bar at 02:45 UTC. Here are its numbers:
- Open 1.12052, high 1.12066, low 1.11666, close 1.11710.
- Body: 34.2 pips. Range: 40.0 pips.
- The close sat 4.4 pips above the low, or 11% of the range. So it passed the outer 20% test.
- Entry at the next open: 1.11711. Stop at the bar’s high: 1.12066, which is 35.5 pips away.
- Exit one hour later: 1.11660. Result: +5.1 pips before costs.
So the second trade risked 35.5 pips to make 5.1. That is about 0.14 of the risk. The chart shows why: price soon bounced and climbed for the rest of the morning. In other words, the burst came late in the move, and most of the drop was already done.
A large burst bar often marks exhaustion as much as fuel. Also, the stop at the far end of a big bar is wide by design. That makes the payoff small compared with the risk, as our page on trading expectancy explains in general terms.
What 4,934 momentum scalping trades showed
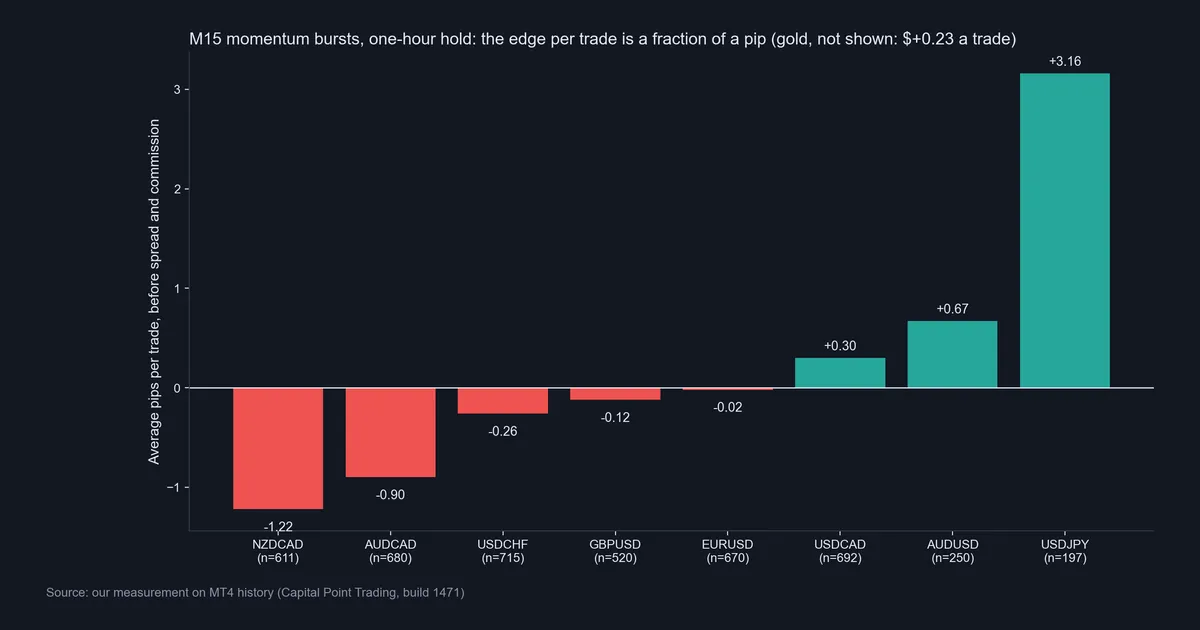
The first chart shows the average result per trade, before spread and commission. Five of the eight currency pairs came out negative. NZDCAD averaged -1.22 pips over 611 trades, and AUDCAD -0.90 over 680. EURUSD sat at -0.02 pips over 670 trades, which is close to zero.
Three pairs came out positive. USDCAD averaged +0.30 pips over 692 trades and AUDUSD +0.67 over 250. USDJPY stood out at +3.16 pips, but on only 197 trades, the smallest sample. Gold averaged +$0.23 a trade over 599 trades, with a median stop of $15.18.
Share of trades that made money
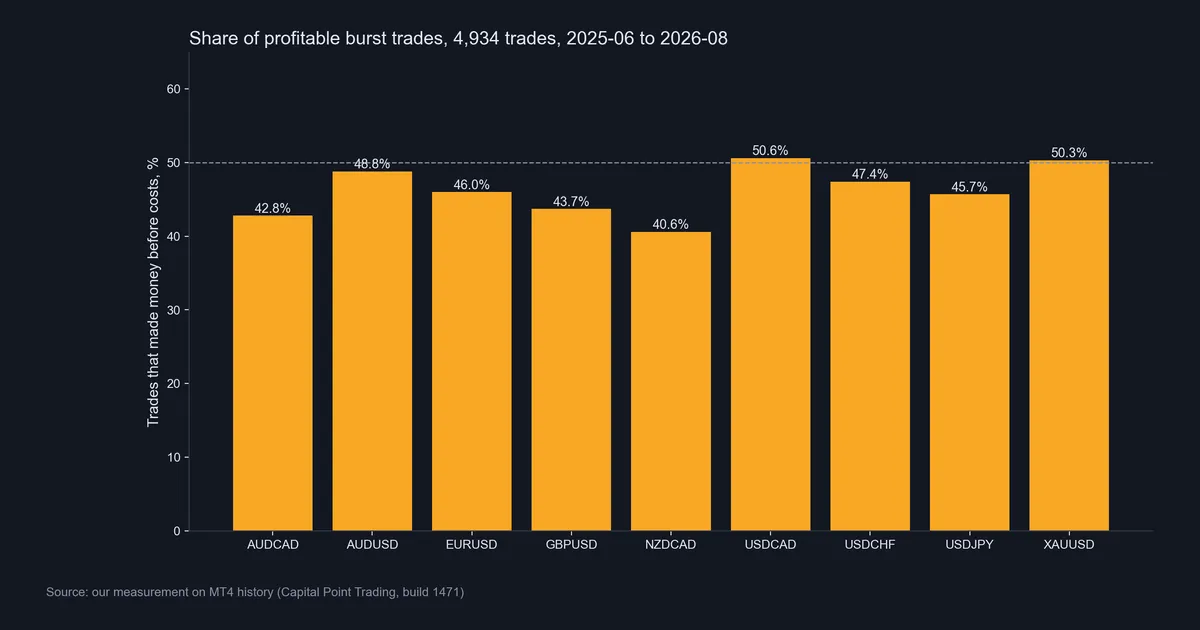
The second chart shows the share of trades that made money before costs. It ranged from 40.6% on NZDCAD to 50.6% on USDCAD. Only USDCAD and gold, at 50.3%, reached half. Most pairs sat in the 40s.
A rule can still make money with fewer than half its trades winning, if winners are larger. Here, though, the average result stayed tiny. In short, the burst rule showed no reliable edge on most pairs. The few positive results are modest and untested out of sample. Our page on backtest sample size explains why 197 trades is too few to trust a figure like USDJPY’s.
Download the complete indicator database
Put these concepts on your charts. One email unlocks the full library of 1,380+ indicators with compiled MT4 and MT5 files, plus my TradingView scripts. No paywall, no spam, unsubscribe any time.
Get free access to my indicator database
One email unlocks 1,380+ free MT4, MT5 and TradingView indicators — the complete library. No single-tool download; you get the whole database.
Why costs decide the result
Every average above is before costs. That changes how you should read it. The average pips per trade is also the round-trip cost that would wipe the result out.
Take USDCAD. It averaged +0.30 pips a trade. So if spread plus commission costs more than 0.30 pips for a round trip, the rule loses money on that pair. AUDUSD’s margin is 0.67 pips. On gold, the margin is about 23 cents a trade.
We cannot tell you your broker’s cost, and we will not guess one. Instead, check your own round-trip cost on each pair and compare it with these figures. Our pages on the spread in forex and on transaction costs in backtests show how to do that. Slippage adds to the bill too, because bursts are exactly when fills move. The slippage article on Wikipedia defines it.
Where it fails
The rule fails in a few clear ways, each seen in our data or charts.
- Late bursts. A big bar often arrives near the end of a move. The EURUSD trade at 02:45 caught only 5.1 pips of follow-through.
- Wide stops. The stop sits at the far end of a large bar. So risk per trade is large compared with the typical gain.
- Thin markets. When volume is low, a small bar can pass a test based on ATR. Then gaps and wide spreads do the damage.
- Costs. On most pairs, the edge before costs was smaller than one pip, so normal trading costs could erase it.
- Time exits. A fixed one-hour exit can close a good trade early or hold a dead one too long.
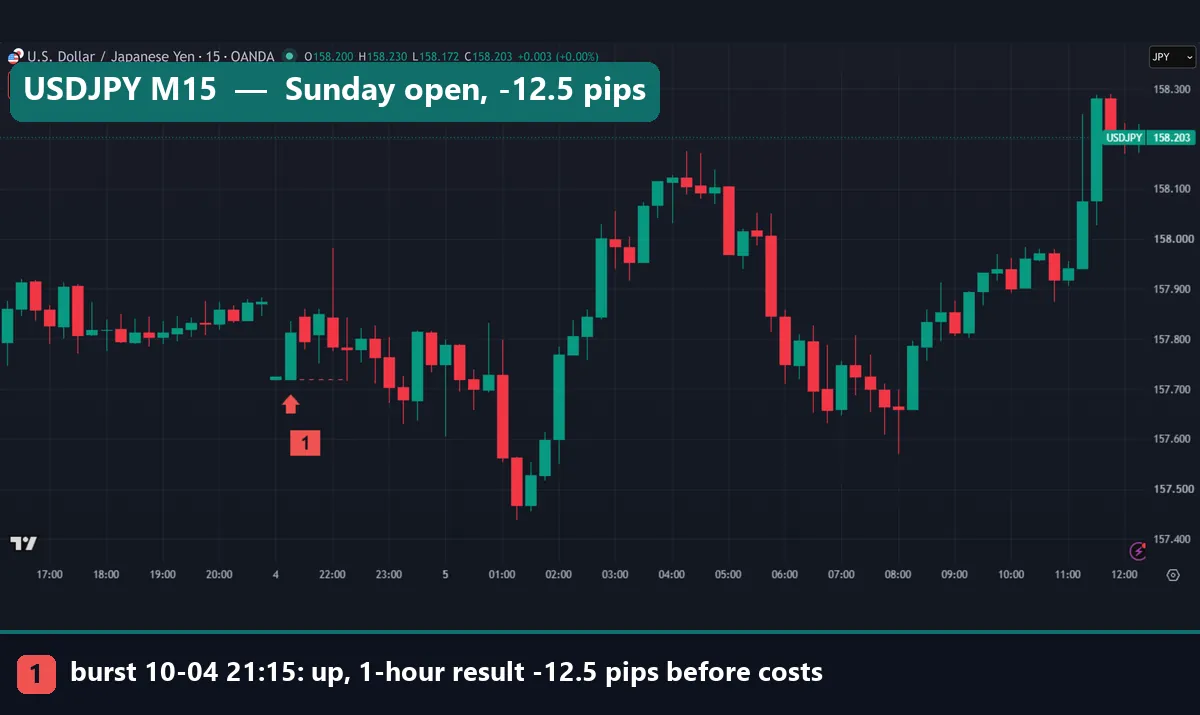
The USDJPY chart shows the thin-market problem. A burst closed at 21:15 UTC on Sunday 4 October 2026, just after the weekly open. The body was only 9.4 pips. Still, the market was so quiet that this passed the 1.5 x ATR test. The next bar opened at 157.844, 3.1 pips above the burst’s close. Within the hour, price fell back to the stop at 157.719. The trade lost 12.5 pips before costs. Our guide to forex trading on the weekend explains why the Sunday open is so thin.
Small winners and the spread
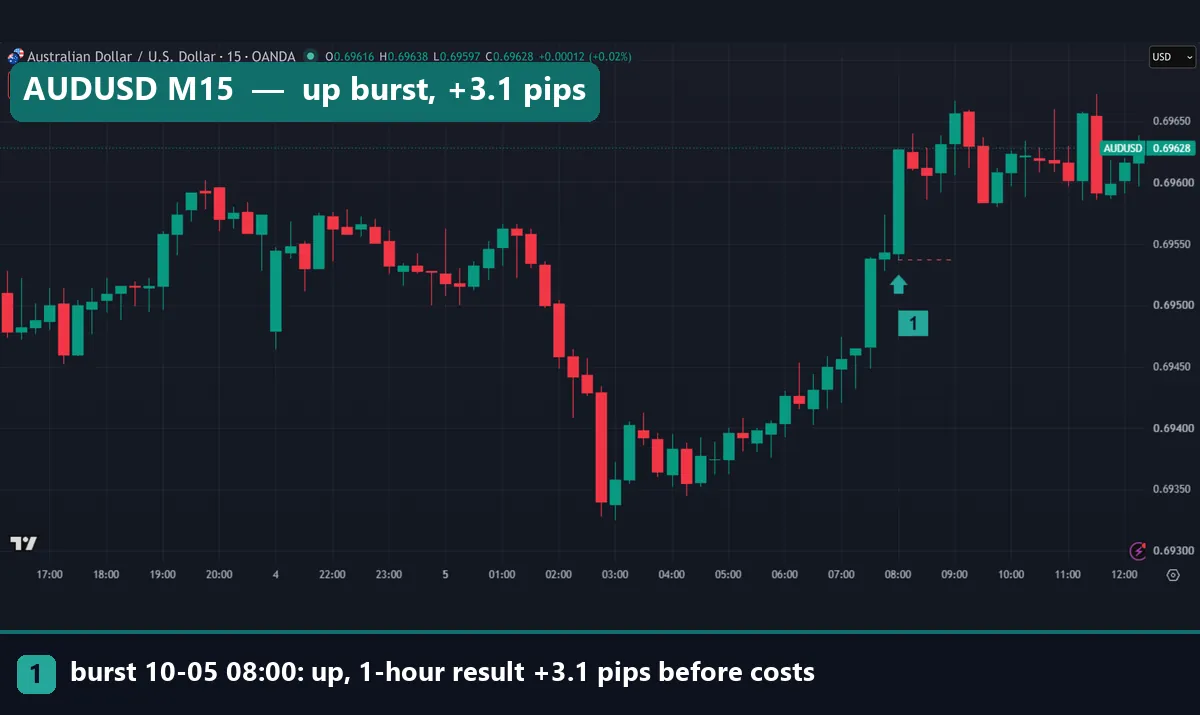
On AUDUSD, an up burst closed at 08:00 UTC on 5 October 2026, right at its high of 0.69627. Entry came at 0.69625, with the stop at 0.69537, 8.8 pips below. One hour later price closed at 0.69656. The trade made 3.1 pips before costs.
A bar earlier, at 07:30 UTC, another burst had made 6.8 pips. Both trades won. But both gains were small enough that the spread and commission would take a real share of them. This timing also matters. Both bursts came in the first hour of London trading, a period our page on the London trading session covers. Spreads are often tighter then than at the Sunday open, which our page on why spreads widen explains.
Common mistakes with momentum scalping
These four mistakes turn a weak rule into a losing one.
- Entering before the bar closes. A bar can look like a burst halfway through and then close in the middle of its range. Wait for the close, or the test means nothing.
- Ignoring costs in a backtest. Our averages were fractions of a pip on most pairs. A backtest without spread and commission will make this style look far better than it is.
- Trusting a small sample. USDJPY’s +3.16 pips came from 197 trades. One good week can create a figure like that.
- Sizing by the gain, not the stop. The stop on a burst trade is wide. So set position size from the stop distance. Our page on risk per trade shows the method.
Where to go next
If you want to keep exploring short-term styles, start with the basics in how to start scalping. Then compare faster methods in our 1-minute forex scalping strategy guide and our tick scalping guide.
For outside reading, the scalping entry in the BabyPips Forexpedia gives a short definition. The ATR pages at TradingView and in the MQL4 documentation, linked above, explain the yardstick our rule uses. If you test your own version, include your real costs from the start.
FAQ about momentum scalping
What is momentum scalping in forex?
It is a short-term style that trades in the direction of a strong, fast bar and exits within minutes or an hour. Our version used 15-minute bars and a one-hour exit.
How did you define a momentum burst?
We used a body of at least 1.5 times ATR(14) and a close in the outer 20% of the bar’s range, on the side of the move.
Did the momentum scalping rule make money?
Not reliably. Five of eight currency pairs averaged a loss before costs. The positive pairs made between 0.30 and 3.16 pips a trade, and gold made about $0.23 a trade.
What share of trades made money?
Between 40.6% and 50.6% before costs, depending on the symbol. Only USDCAD and gold reached half.
Why are the results shown before costs?
The MT4 history on our terminal does not store usable spreads. So we report results before spread, swap and commission, and you should compare them with your own costs.
Which timeframe suits momentum scalping best?
We only tested M15, so we cannot rank timeframes. Shorter charts make bursts more frequent, but they also make costs a larger share of each trade.
Can I use the same settings on gold?
You can, but the stops get wide. The median stop on gold in our test was $15.18, against an average gain of about $0.23 a trade before costs.
Is momentum scalping a strategy that works?
Our test showed no reliable edge on most symbols, and the few positive results are small and untested out of sample; results are not guaranteed; past performance is not indicative of future results.
Last updated: 5 October 2026.

About the author
Written by Dominic Walsh, a Forex trader and MT4/MT5 indicator, Expert Advisor and script developer. Every tool on forexmt4systems.com is tested on live charts before release and ships with ready-to-use compiled MT4 (.ex4) and MT5 (.ex5) files. Learn more about the trader and developer behind this site.
How we build, test and correct every tool: Editorial & Testing Policy. Trading carries risk; see the disclaimer.