Skip to content
  • About Us
  • Contact Us
  • Privacy Policy
  • Disclaimer
  • Install Guide
  • Editorial Policy
ForexMT4Systems
  • Indicators
    • MT4 Indicators
    • MT5 Indicators
    • AI
    • Bands and Channels
    • Binary Options
    • Breakout
    • Candle Sticks
    • Currency Strength
    • Cycles
    • Elliott Wave
    • Fibonacci
    • Gann
    • Harmonic
    • Heatmap
    • ICT
    • Ichimoku
    • Intraday
    • Levels
    • Liquidity
    • MACD
    • Momentum
    • Moving Average
    • Multi-Timeframe
    • News
    • Non-Repaint
    • Order Book
    • Order Flow
    • Oscillators
    • Overbought and Oversold
    • Pattern Recognition
    • Pivot Points and Fractals
    • Price Action
    • RSI
    • Range
    • Reversal
    • Risk Management
    • Scalper
    • Sessions
    • Signal and Forecast
    • Smart Money
    • Supply and Demand
    • Support and Resistance
    • Swing Trading
    • Trend
    • VWAP
    • Volatility
    • Volume
    • Volume Profile
    • ZigZag
  • Expert Advisors
  • Scripts
  • TradingView
    • All Free TradingView Indicators
    • Premium TradingView Indicators
  • Strategies
    • Forex
    • Breakout
    • Day Trading
    • ICT and SMC
    • Mean Reversion
    • News
    • Position
    • Price Action
    • Scalping
    • Swing
  • Guides
    • Best Indicators
    • Comparisons
    • How-To Guides
    • Indicator Settings
    • Currency Pairs
    • Timeframes
  • Education
    • Smart Money Concepts
    • Technical Analysis
    • Forex Basics
    • Risk Management
    • Prop Firm Trading
    • Trading Psychology
    • Candlestick Patterns
    • Chart Patterns
    • Fundamental Analysis
    • Trading Styles
    • Trading Plan and Journal
    • Order Types and Execution
    • Automated and Copy Trading
    • Market Sentiment
    • Forex Brokers
    • Backtesting and Systems
  • Tools
    • Position Size Calculator
    • Pip Value Calculator
    • Profit Calculator
    • Risk Reward Calculator
    • Trading Journal
    • Economic Calendar
    • Market Hours Clock
    • Forex Heatmap
    • View All 41 tools ->

Education

Free forex trading education across every part of the craft: plain-English basics, technical and fundamental analysis, Smart Money Concepts, risk management, psychology, and prop firm trading. Every guide is written around real charts and links to the matching free tools and indicators. Pick a topic below, or see every guide in one list.Smart Money Concepts 58 guidesSmart Money Concepts and ICT education: order blocks, fair value gaps, liquidity, kill zones, and market structure explained step by step.Technical Analysis 50 guidesLearn how RSI, MACD, moving averages, Bollinger Bands, and other forex indicators actually work, with settings and reading rules explained.Forex Basics 28 guidesPlain-English forex basics for beginners: pips, lots, leverage, spreads, sessions, currency pairs, and how MT4 and MT5 work in practice.Risk Management 27 guidesForex risk management education: position sizing, risk-reward ratios, stop losses, leverage, drawdown control, and capital protection rules.Prop Firm Trading 29 guidesProp firm trading education: how funding challenges work, drawdown rules, payout models, and strategies to pass and stay funded.Trading Psychology 25 guidesTrading psychology guides: discipline, FOMO, revenge trading, loss aversion, and the mental routines that keep forex traders consistent.Candlestick Patterns 25 guidesCandlestick patterns explained for forex traders: pin bars, engulfing, doji, Heiken Ashi, and how to read single and multi-candle signals.Chart Patterns 25 guidesChart pattern education: head and shoulders, double tops, triangles, harmonic patterns, and Elliott Wave theory explained with examples.Fundamental Analysis 24 guidesForex fundamental analysis explained: interest rates, economic news, NFP, carry trades, and how macro events move currency pairs.Trading Styles 19 guidesTrading styles compared and explained: scalping, day trading, swing trading, position trading, and how to pick the style that fits you.Trading Plan and Journal 15 guidesTrading plan and journal education: build trading rules, log trades, review performance, and turn journaling into better decisions.Order Types and Execution 13 guidesOrder types and execution explained: market, limit, and stop orders, slippage, spreads, and how forex trades are actually filled.Automated and Copy Trading 20 guidesAutomated and copy trading explained: expert advisors, trading bots, copy trading platforms, VPS hosting, and realistic expectations.Market Sentiment 14 guidesMarket sentiment education for forex: COT reports, positioning data, fear and greed, and how to read what other traders are doing.Forex Brokers 14 guidesForex broker education: regulation, ECN vs market maker, spreads, commissions, and how to choose and test a broker with confidence.Backtesting and Systems 15 guidesBacktesting education: test strategies on historical data, avoid curve fitting, run forward tests, and read performance metrics correctly.
Elliott Wave Fibonacci Targets and the Ratios That Recur

elliott wave fibonacci targets - Elliott Wave Fibonacci Targets and the Ratios That Recur featured image

Wave analysts lean on a small set of ratios. Elliott wave fibonacci targets describe where a leg has often finished in the past, and nothing stronger than that. This guide …

Leave a comment

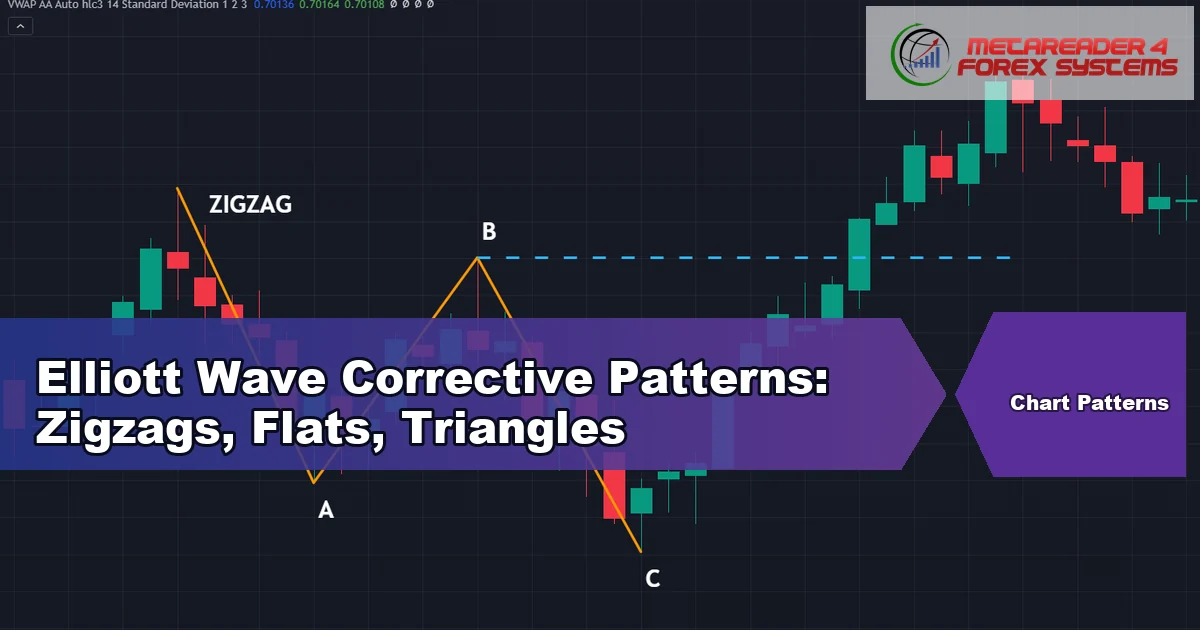
Elliott Wave Corrective Patterns: Zigzags, Flats, Triangles

elliott wave corrective patterns - Elliott Wave Corrective Patterns: Zigzags, Flats, Triangles featured image

Impulses look tidy on a chart. Elliott wave corrective patterns rarely do, and that gap causes most of the frustration traders feel with wave analysis. This guide covers the three …

Leave a comment

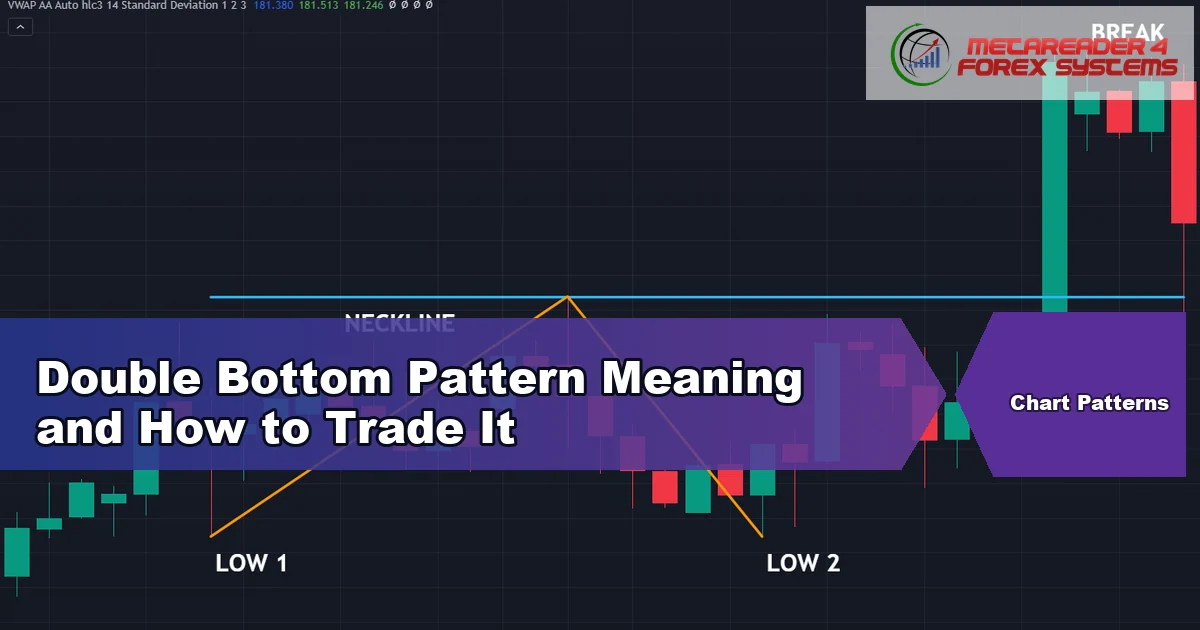
Double Bottom Pattern Meaning and How to Trade It

double bottom pattern meaning - Double Bottom Pattern Meaning and How to Trade It featured image

The double bottom pattern meaning starts with a level that stopped a decline twice. Two lows form at a similar price, a peak sits between them, and only a close …

Leave a comment

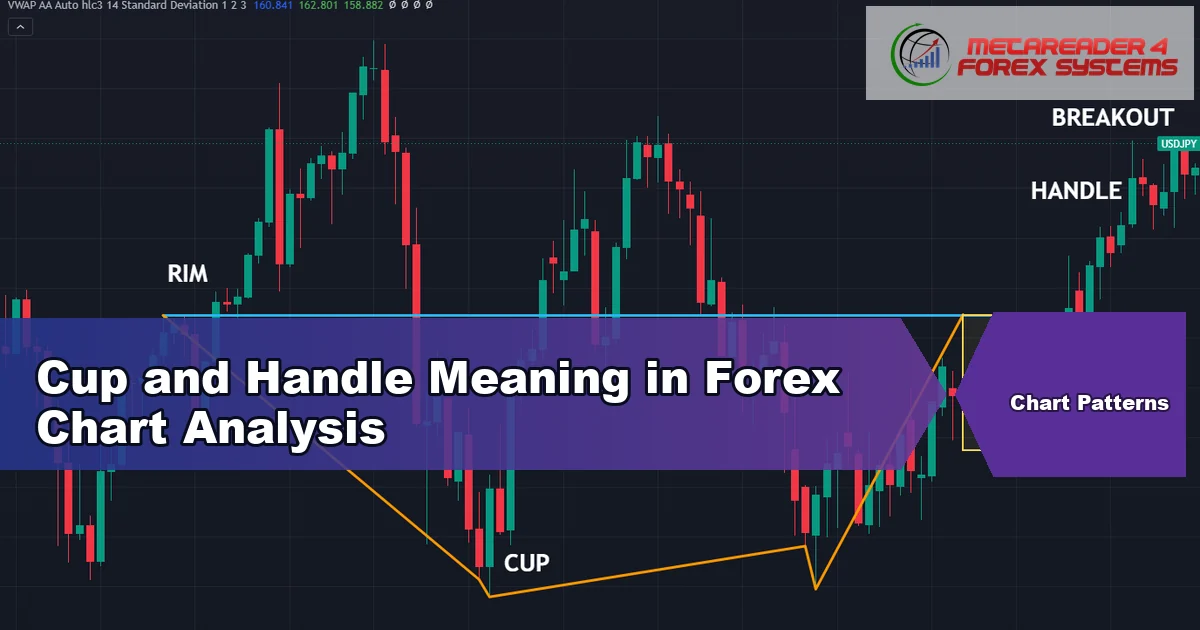
Cup and Handle Meaning in Forex Chart Analysis

cup and handle meaning - Cup and Handle Meaning in Forex Chart Analysis featured image

The cup and handle meaning rests on one word: roundness. A base that curves gradually between two similar highs, followed by a shallow pullback, is what separates this shape from …

Leave a comment

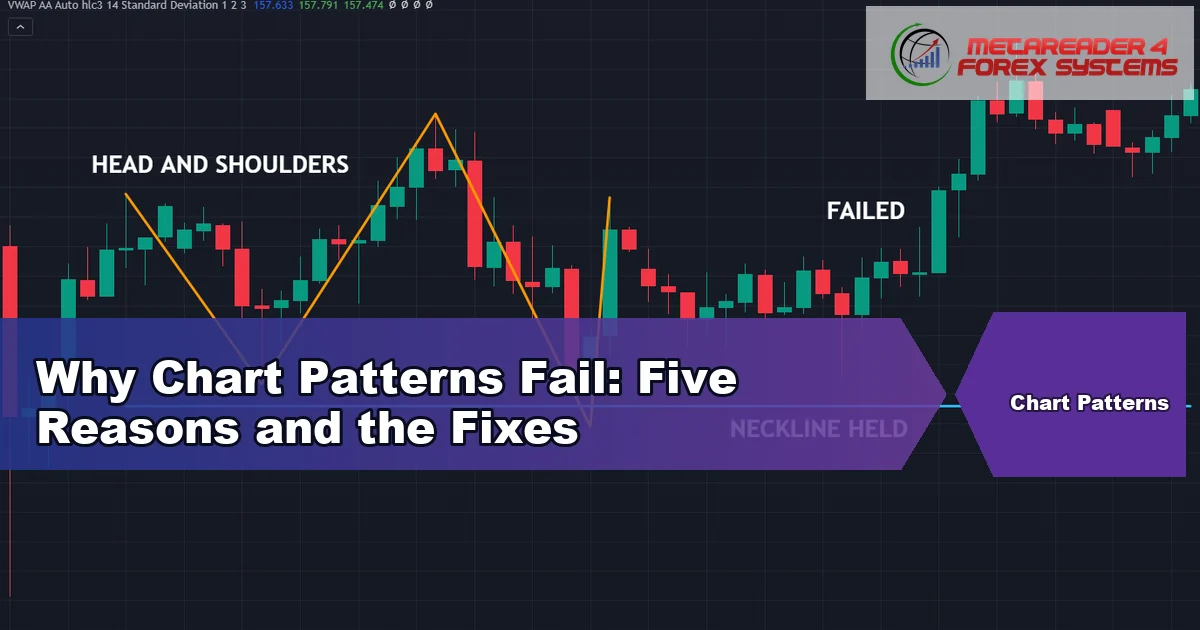
Why Chart Patterns Fail: Five Reasons and the Fixes

why chart patterns fail - Why Chart Patterns Fail: Five Reasons and the Fixes featured image

Every pattern guide shows you the textbook example that worked. Almost none of them explain why chart patterns fail so often, which leaves traders blaming themselves for something structural. This …

Leave a comment

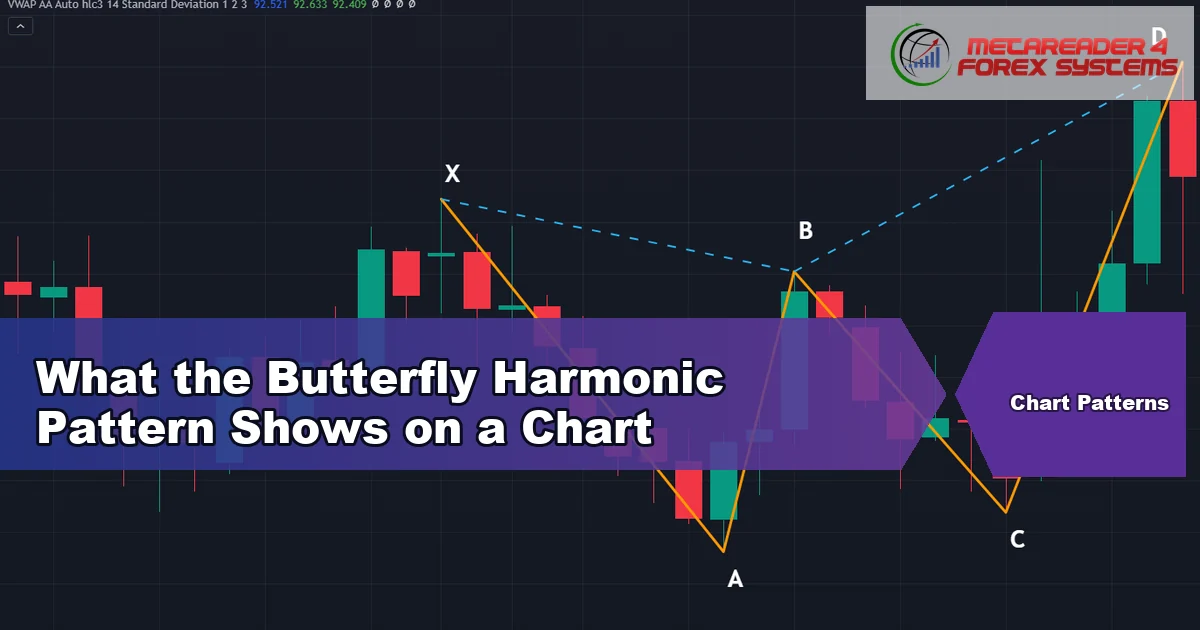
What the Butterfly Harmonic Pattern Shows on a Chart

butterfly harmonic pattern - What the Butterfly Harmonic Pattern Shows on a Chart featured image

The butterfly harmonic pattern is the member of the family that refuses to stay inside its own first leg. Point B retraces about 0.786 of XA, and point D finishes …

Leave a comment

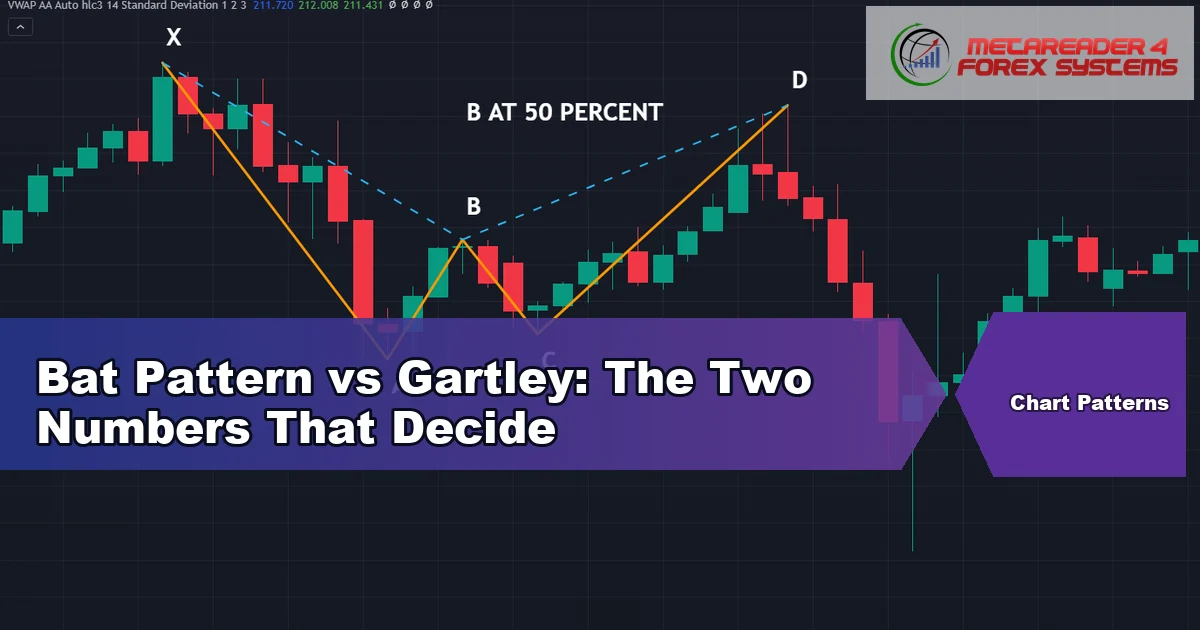
Bat Pattern vs Gartley: The Two Numbers That Decide

bat pattern vs gartley - Bat Pattern vs Gartley: The Two Numbers That Decide featured image

Bat pattern vs gartley comes down to two measurements and nothing else. The B point retraces about 0.382 to 0.5 of XA in a bat, against roughly 0.618 in a …

Leave a comment

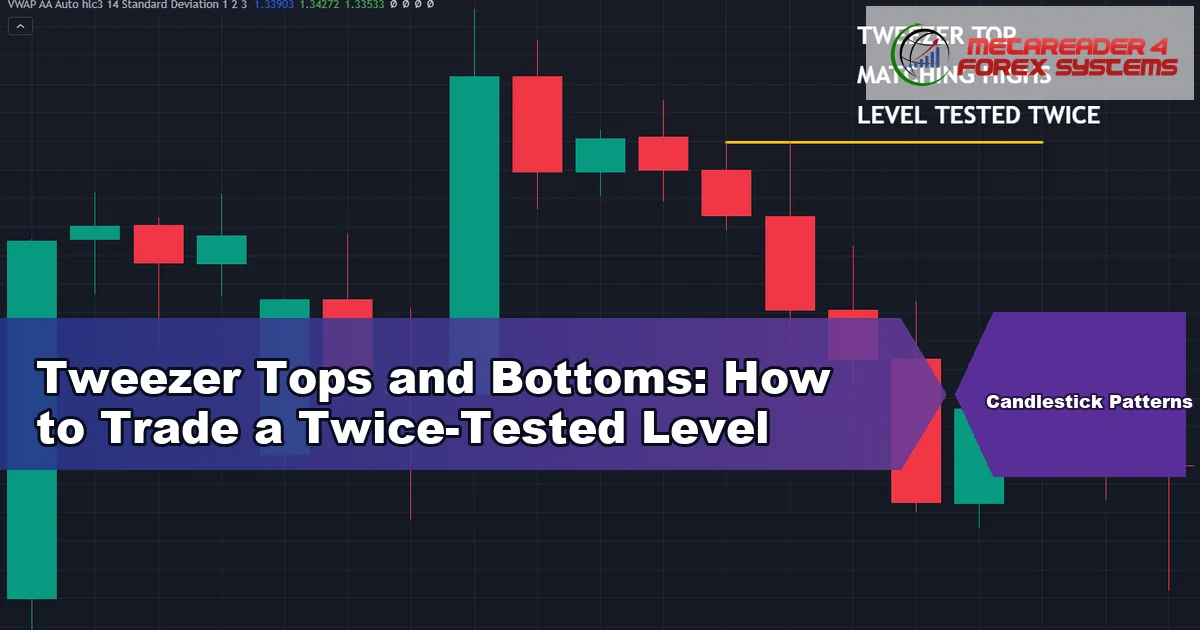
Tweezer Tops and Bottoms: How to Trade a Twice-Tested Level

tweezer tops and bottoms - Tweezer Tops and Bottoms: How to Trade a Twice-Tested Level featured image

Tweezer tops and bottoms describe two or more neighbouring bars that share almost exactly the same extreme. Two matching highs form a tweezer top, and two matching lows form a …

Leave a comment

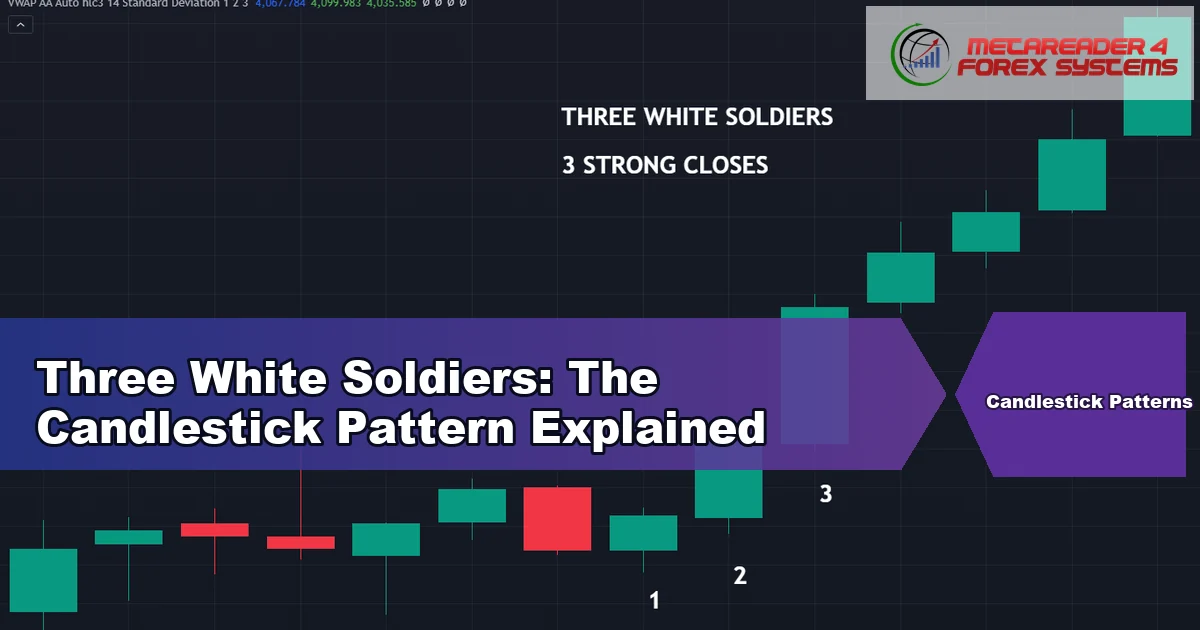
Three White Soldiers: The Candlestick Pattern Explained

three white soldiers - Three White Soldiers: The Candlestick Pattern Explained featured image

Three white soldiers describes a run of three strong bullish bars in a row. Each one opens inside the previous body and closes near its own high, which paints a …

Leave a comment

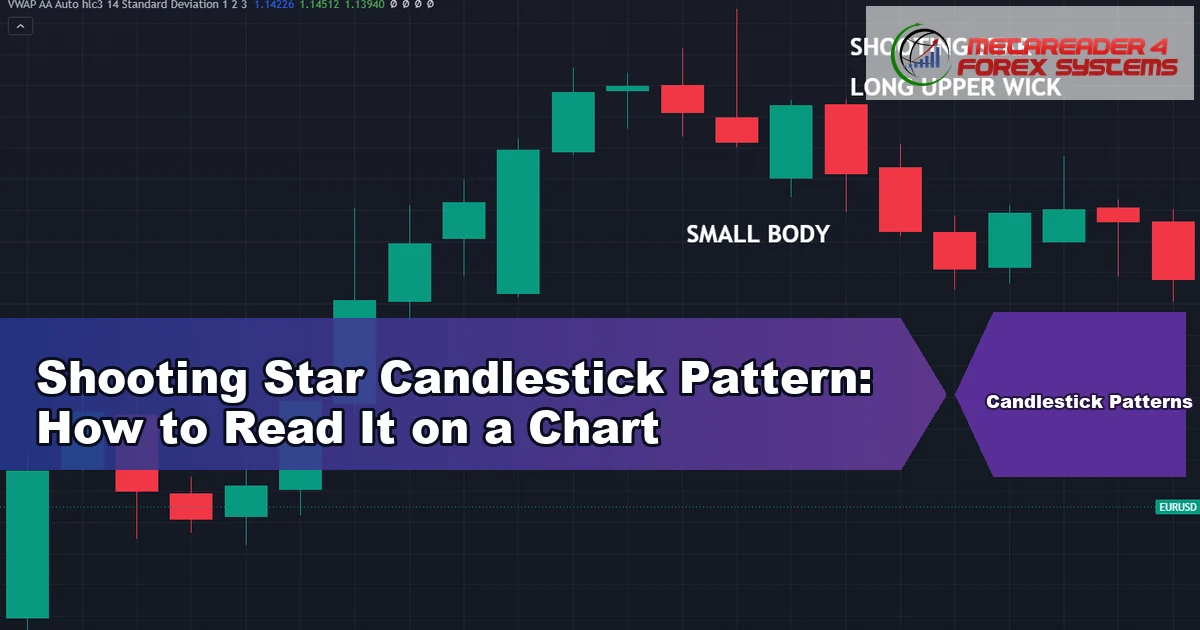
Shooting Star Candlestick Pattern: How to Read It on a Chart

shooting star candlestick pattern - Shooting Star Candlestick Pattern: How to Read It on a Chart featured image

One session climbs hard, meets sellers, and hands back everything it gained. The shooting star candlestick pattern records exactly that, in a single bar with a long tail above a …

Leave a comment

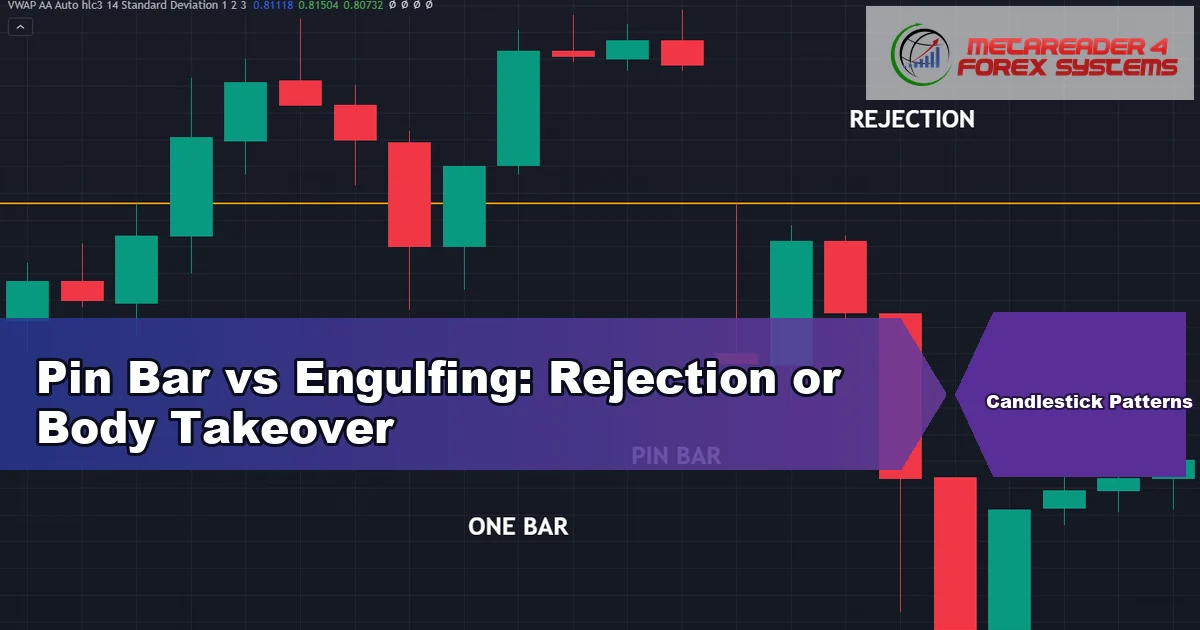
Pin Bar vs Engulfing: Rejection or Body Takeover

pin bar vs engulfing - Pin Bar vs Engulfing: Rejection or Body Takeover featured image

A single long-wicked bar and a two-bar body takeover often show up at the very same turning point. The pin bar vs engulfing question comes down to one clean idea: …

Leave a comment

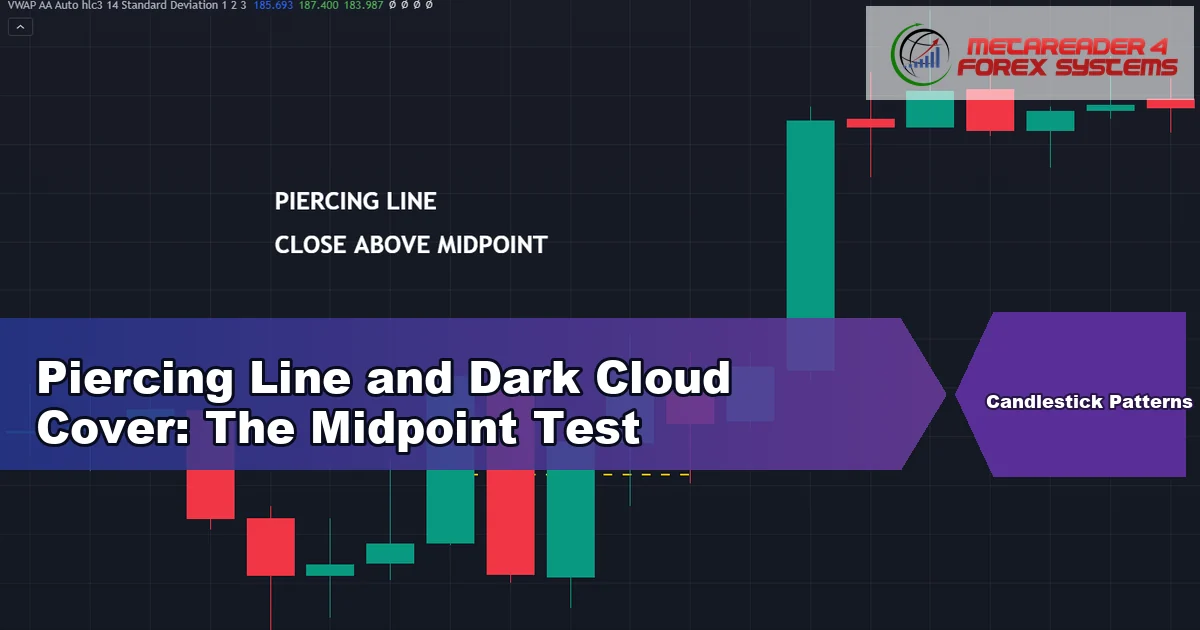
Piercing Line and Dark Cloud Cover: The Midpoint Test

piercing line and dark cloud cover - Piercing Line and Dark Cloud Cover: The Midpoint Test featured image

The piercing line and dark cloud cover are mirror-image two-bar patterns, and both hinge on one measurement. The second bar has to close beyond the midpoint of the first bar’s …

Leave a comment

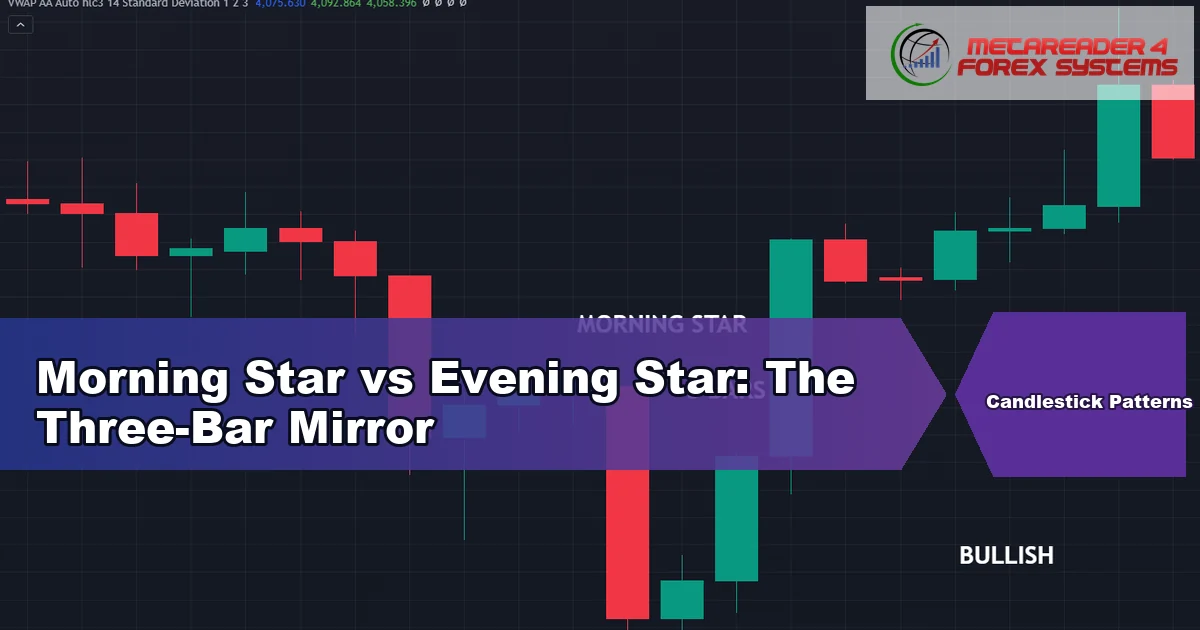
Morning Star vs Evening Star: The Three-Bar Mirror

morning star vs evening star - Morning Star vs Evening Star: The Three-Bar Mirror featured image

The morning star vs evening star question has one clean answer, and everything else follows from it. Both patterns use the same three-bar skeleton, and only the direction of the …

Leave a comment

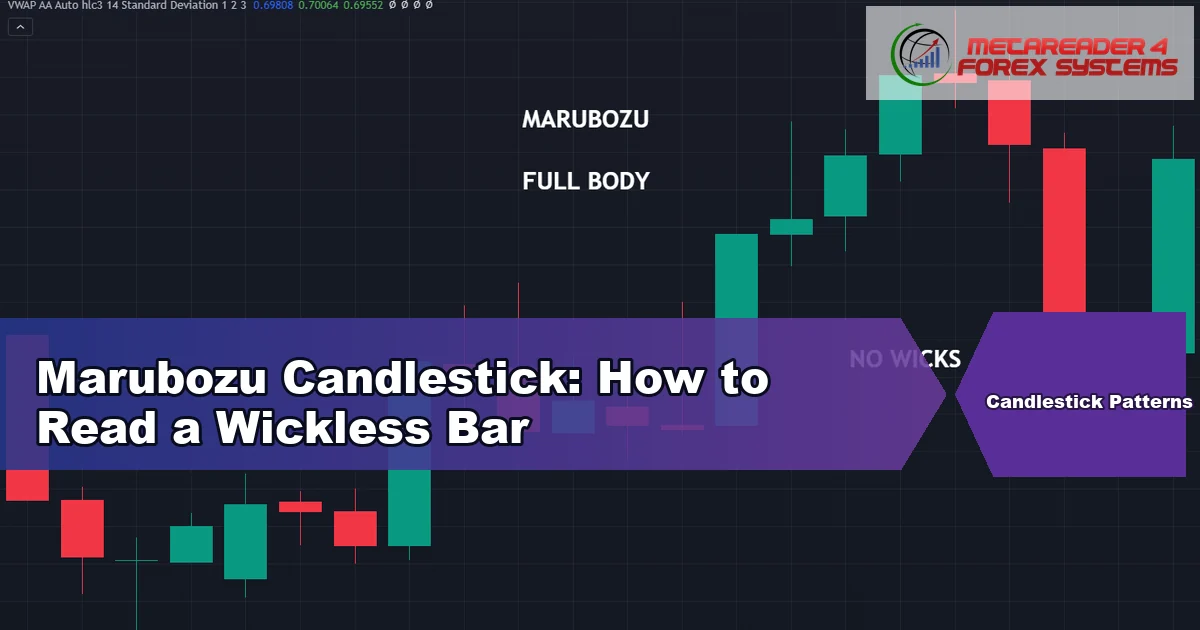
Marubozu Candlestick: How to Read a Wickless Bar

marubozu candlestick - Marubozu Candlestick: How to Read a Wickless Bar featured image

Most candle patterns get their meaning from a wick. A marubozu candlestick works the other way round, because it has no wick worth mentioning at either end. Learning to read …

Leave a comment

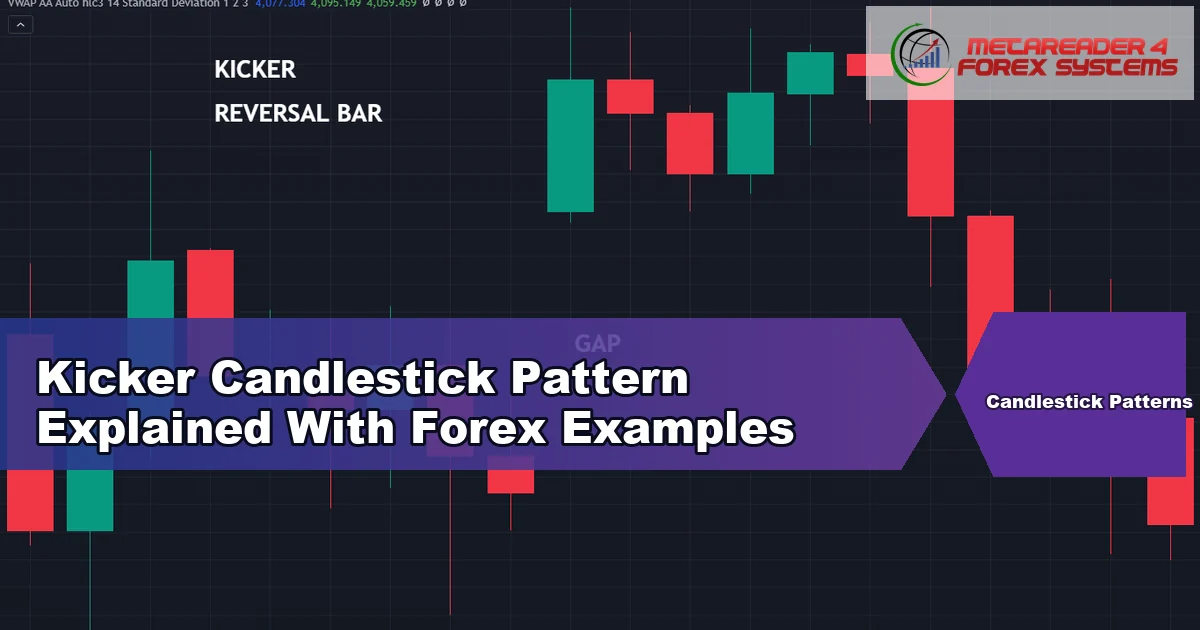
Kicker Candlestick Pattern Explained With Forex Examples

kicker candlestick pattern - Kicker Candlestick Pattern Explained With Forex Examples featured image

The kicker candlestick pattern describes one of the sharpest turns a chart can print. One bar runs with the trend, the next bar opens beyond it in the other direction, …

Leave a comment

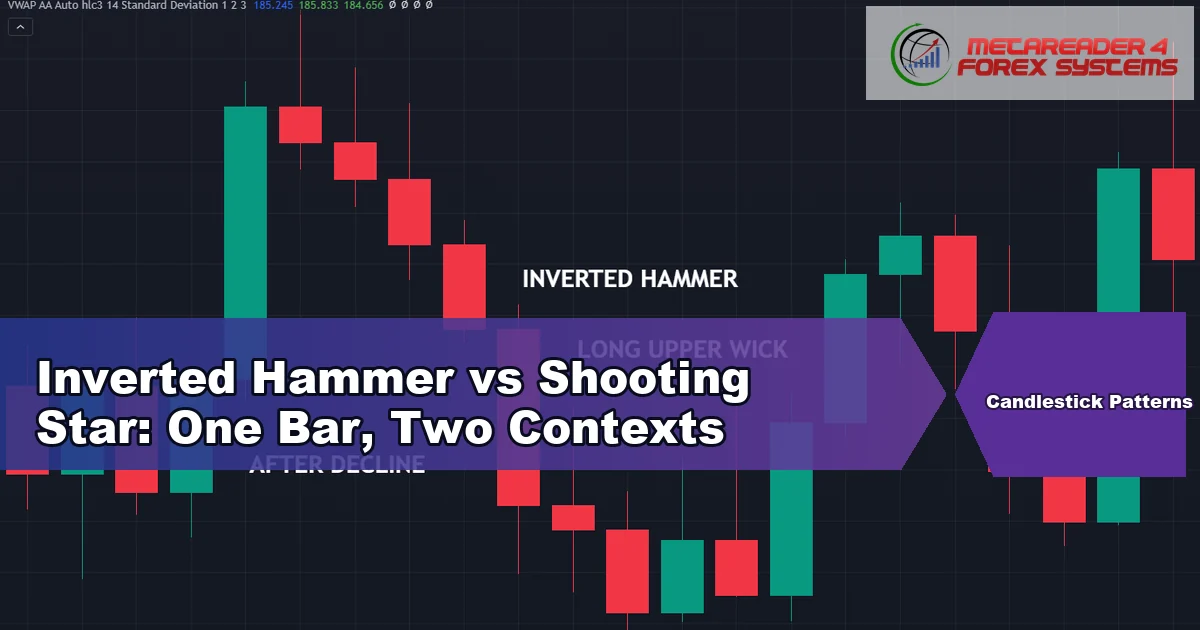
Inverted Hammer vs Shooting Star: One Bar, Two Contexts

inverted hammer vs shooting star - Inverted Hammer vs Shooting Star: One Bar, Two Contexts featured image

Flip a hammer upside down and you get a bar with a long tail above the body. The inverted hammer vs shooting star question then works exactly like its right-way-up …

Leave a comment

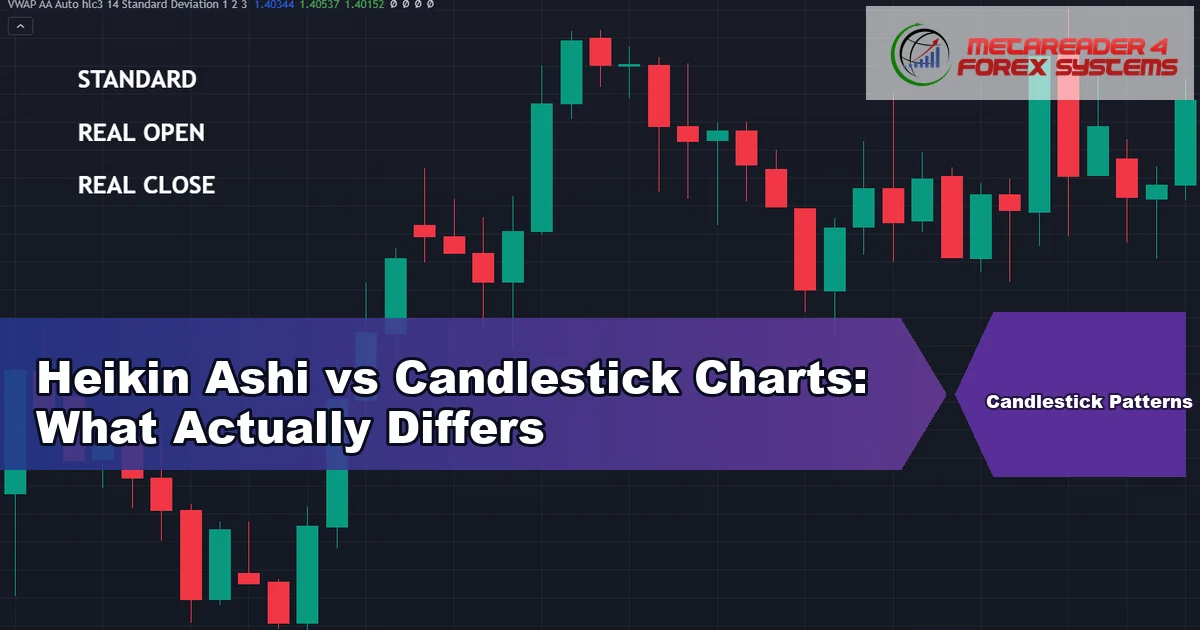
Heikin Ashi vs Candlestick Charts: What Actually Differs

heikin ashi vs candlestick - Heikin Ashi vs Candlestick Charts: What Actually Differs featured image

Two charts of the same market can look nothing alike. The heikin ashi vs candlestick difference explains why, and it comes down to one thing: real prices against averaged ones. …

Leave a comment

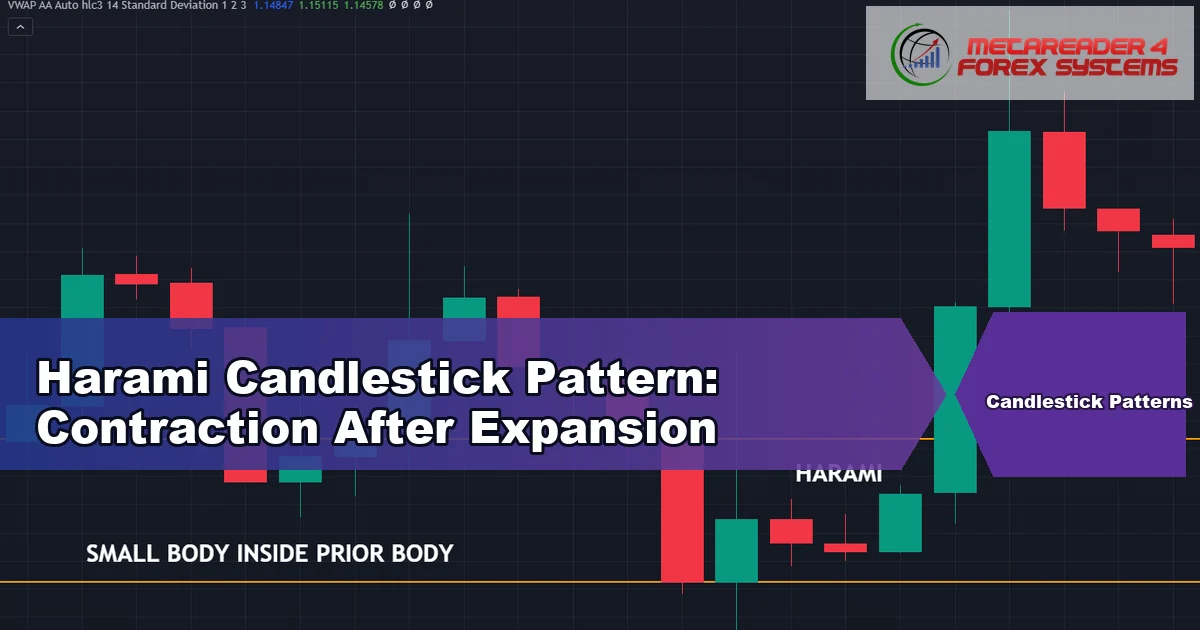
Harami Candlestick Pattern: Contraction After Expansion

harami candlestick pattern - Harami Candlestick Pattern: Contraction After Expansion featured image

The harami candlestick pattern describes a market that just stopped expanding. A big body prints, then a small body sits entirely inside it, and the argument that drove the previous …

Leave a comment

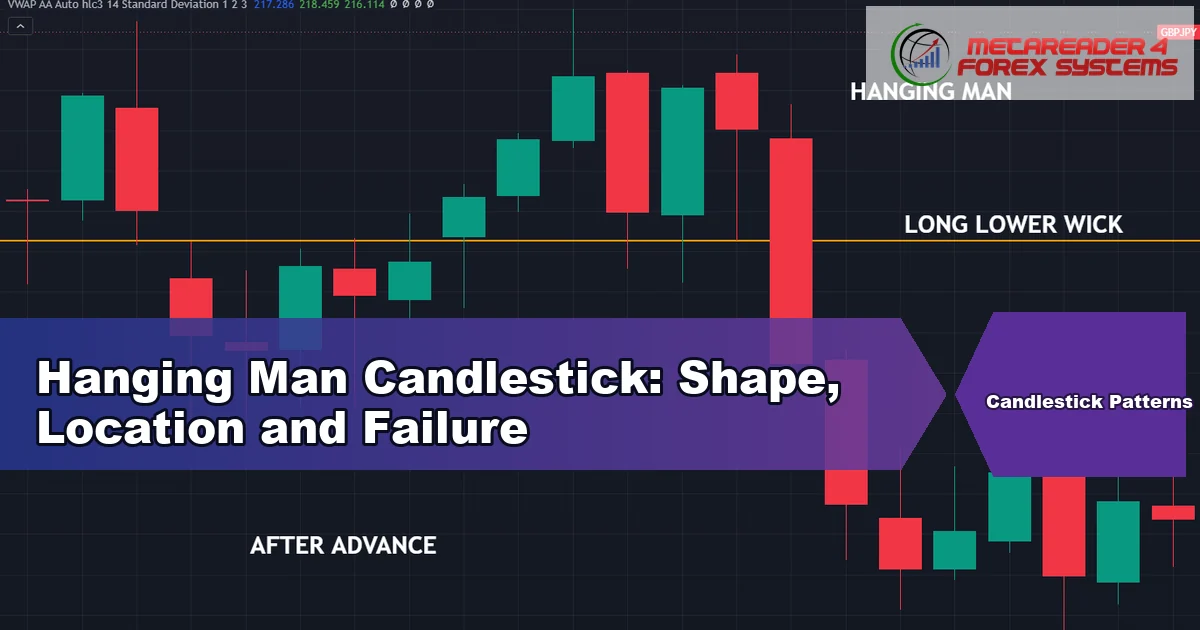
Hanging Man Candlestick: Shape, Location and Failure

hanging man candlestick - Hanging Man Candlestick: Shape, Location and Failure featured image

The hanging man candlestick has an odd name and a very simple shape. A small body sits at the top of the range, a long wick hangs below it, and …

Leave a comment

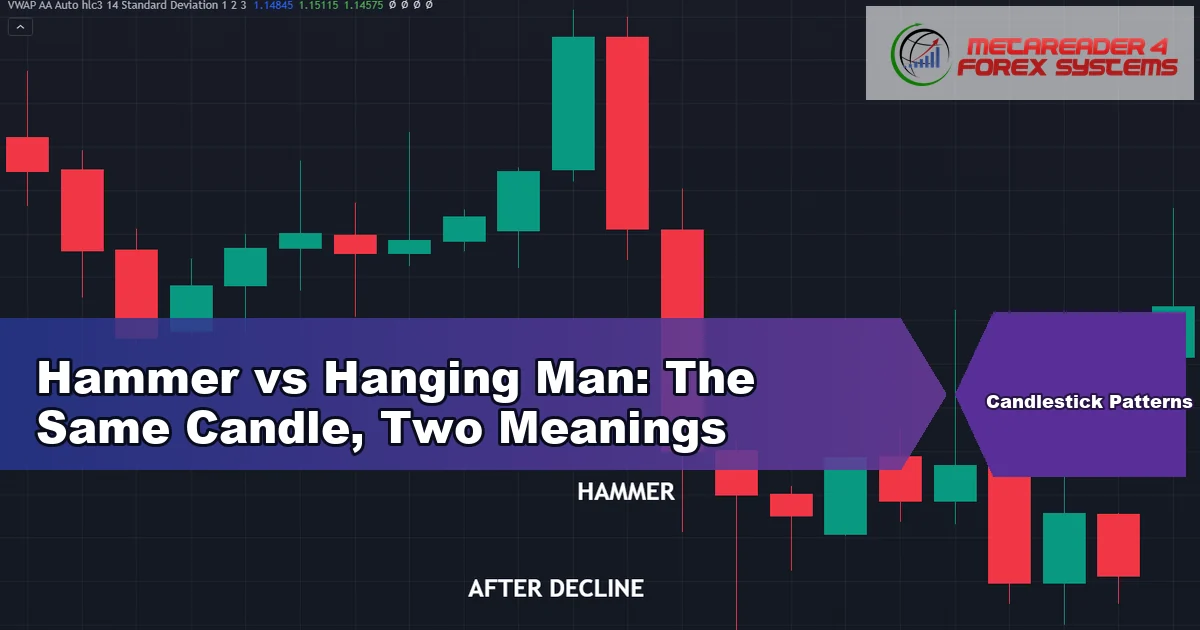
Hammer vs Hanging Man: The Same Candle, Two Meanings

hammer vs hanging man - Hammer vs Hanging Man: The Same Candle, Two Meanings featured image

Two of the most talked-about candles on any chart look completely identical. The hammer vs hanging man question never turns on shape, because both bars print exactly the same geometry. …

Leave a comment

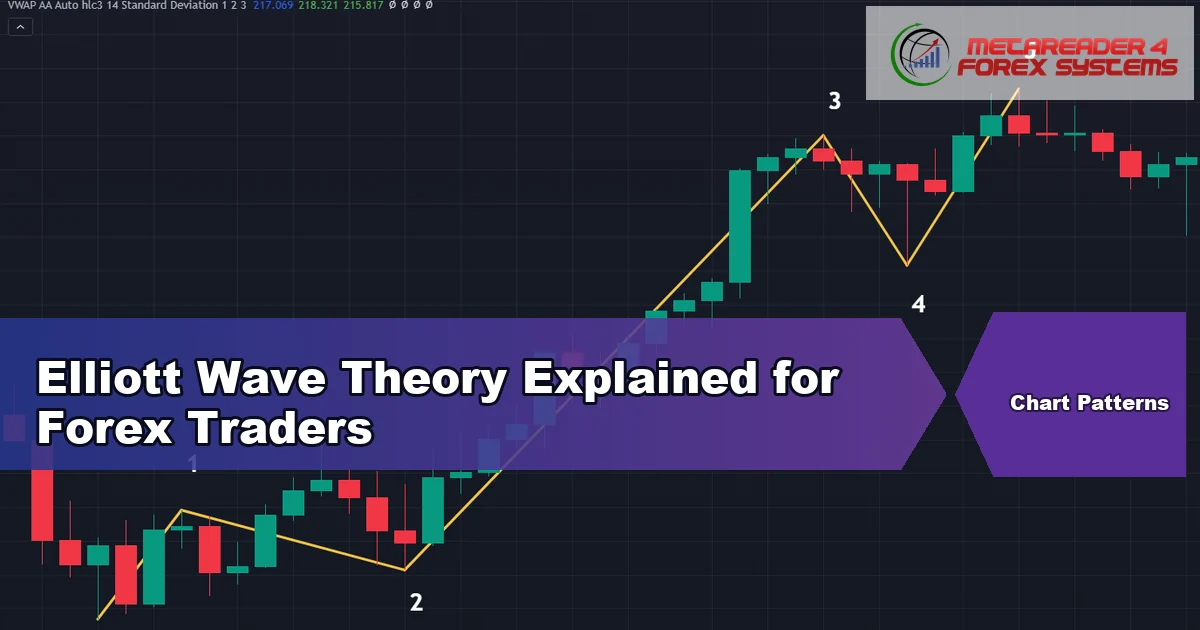
Elliott Wave Theory Explained for Forex Traders

elliott wave theory - Elliott Wave Theory Explained for Forex Traders featured image

Elliott wave theory says market moves unfold in repeating shapes: five waves with the larger trend, then three against it. Ralph Nelson Elliott built that model in the 1930s from …

Leave a comment

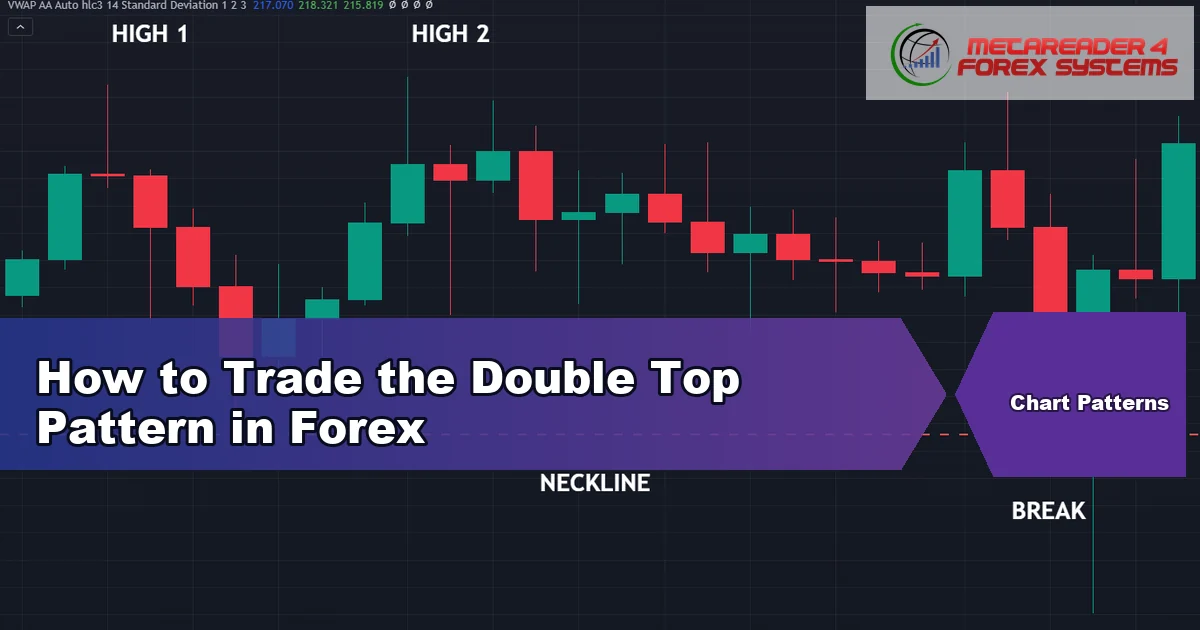
How to Trade the Double Top Pattern in Forex

double top pattern - How to Trade the Double Top Pattern in Forex featured image

The double top pattern marks a level that turned price away twice. Two highs form at roughly the same price, a trough sits between them, and only a close below …

Leave a comment

Do Candlestick Patterns Work? What the Evidence Shows

do candlestick patterns work - Do Candlestick Patterns Work? What the Evidence Shows featured image

Ask do candlestick patterns work and two loud camps answer at once. One treats every hammer as a signal, and the other calls the whole thing folklore. The honest answer …

Leave a comment

Candlestick Wicks Meaning: What Long Shadows Tell You

candlestick wicks meaning - Candlestick Wicks Meaning: What Long Shadows Tell You featured image

Every candle on your chart carries two stories. The body records where the session started and finished, while the wicks record everywhere price went and failed to stay. Candlestick wicks …

Leave a comment

How to Trade Candlestick Patterns at Support and Resistance

candlestick patterns at support and resistance - How to Trade Candlestick Patterns at Support and Resistance featured image

A candlestick tells you what just happened inside one bar. Candlestick patterns at support and resistance carry far more weight than the identical shapes printed in the middle of a …

Leave a comment

Candlestick Patterns Explained: A Practical Guide

candlestick patterns explained - Candlestick Patterns Explained: A Practical Guide featured image

You want candlestick patterns explained without the usual promises, so start with what a single bar really holds. Each candle packs four prices into one shape, and that shape shows …

Leave a comment

Bearish Candlestick Patterns Explained for Forex Charts

bearish candlestick patterns - Bearish Candlestick Patterns Explained for Forex Charts featured image

Bearish candlestick patterns describe one thing: a session where sellers took the upper hand. They record what just happened on the chart, and they never promise what happens next. This …

Leave a comment

What Is Heikin Ashi? The Formula and Its Real Limits

what is heikin ashi - What Is Heikin Ashi? The Formula and Its Real Limits featured image

What is heikin ashi, in one sentence? It is a modified candle calculation that averages price values, so a chart of trends looks smoother than the raw bars behind it. …

Leave a comment

How to Manage Trading Stress: A Practical Daily Routine

how to manage trading stress - How to Manage Trading Stress: A Practical Daily Routine featured image

Learning how to manage trading stress matters more than most traders admit. The pressure rarely announces itself, yet it shows up in every decision you make at the screen. This …

Leave a comment

Nine Trading Psychology Books and How to Actually Use Them

trading psychology books - Nine Trading Psychology Books and How to Actually Use Them featured image

Trading psychology books fill more shelf space every year, and most readers finish them unchanged. The ideas land, the highlighting looks impressive, then Monday arrives and nothing about the account …

Leave a comment

Tilt in Trading: What It Is and How to Break the Spiral

tilt in trading - Tilt in Trading: What It Is and How to Break the Spiral featured image

Tilt in trading describes the state where emotion takes the wheel after a bad loss. The plan stays on the desk while your hands keep clicking. The word arrives from …

Leave a comment

Trading Psychology vs Technical Analysis: The Real Answer

trading psychology vs technical analysis - Trading Psychology vs Technical Analysis: The Real Answer featured image

Ask a trading forum which one matters more and the trading psychology vs technical analysis argument starts within three replies. One camp swears the chart decides everything. The other insists …

Leave a comment

Trading Psychology for Prop Firm Challenges: Rule by Rule

trading psychology for prop firm challenges - Trading Psychology for Prop Firm Challenges: Rule by Rule featured image

Trading psychology for prop firm challenges differs from ordinary trading psychology in one important way. The pressure here comes from the rule book, not only from your own head. An …

Leave a comment

Pin Bar Meaning: The Rejection Bar, Explained Honestly

pin bar meaning - Pin Bar Meaning: The Rejection Bar, Explained Honestly featured image

Pin bar meaning comes from a single bar with one very long wick and a small body tucked at the opposite end. Price ran hard in one direction, then gave …

Leave a comment

Overconfidence in Trading: The Mistakes It Creates

overconfidence in trading - Overconfidence in Trading: The Mistakes It Creates featured image

Overconfidence in trading rarely feels like a problem while it happens. It feels like competence, and that disguise makes it the most expensive bias in the book. This guide works …

Leave a comment

Morning Star Pattern Meaning: The Three-Bar Handover

morning star pattern meaning - Morning Star Pattern Meaning: The Three-Bar Handover featured image

Morning star pattern meaning rests on three consecutive bars rather than one. A large bearish candle, a small indecision candle, and a strong bullish candle that closes deep into the …

Leave a comment

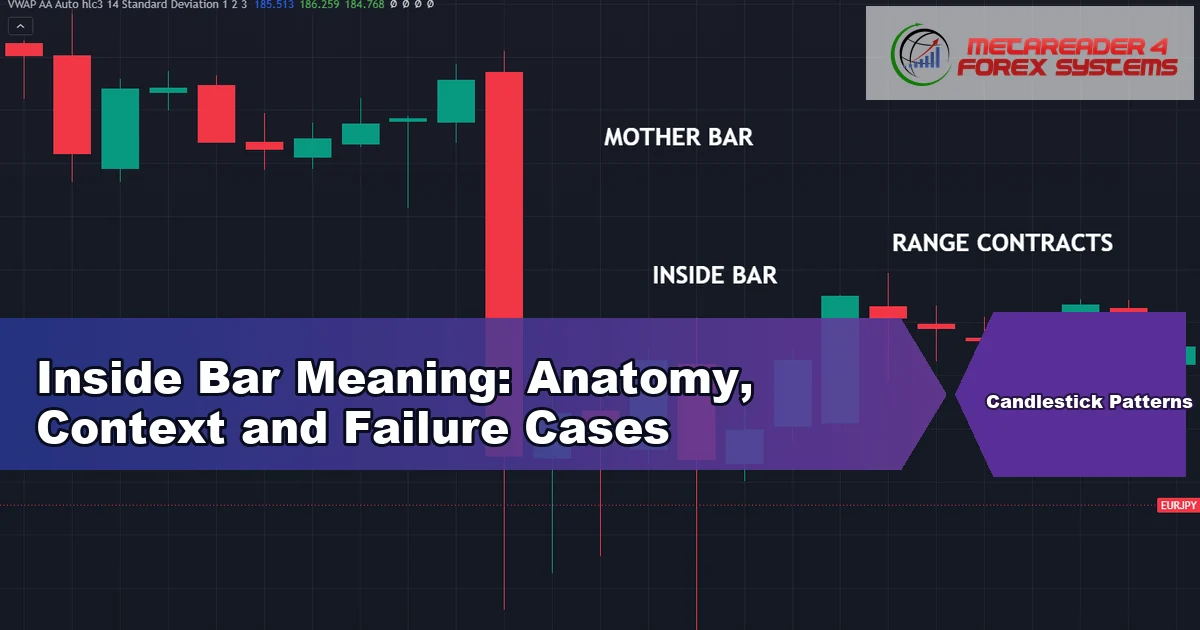
Inside Bar Meaning: Anatomy, Context and Failure Cases

inside bar meaning - Inside Bar Meaning: Anatomy, Context and Failure Cases featured image

The inside bar meaning is simple enough to state in one line, which is why so many traders stop there. A bar sits entirely inside the range of the bar …

Leave a comment

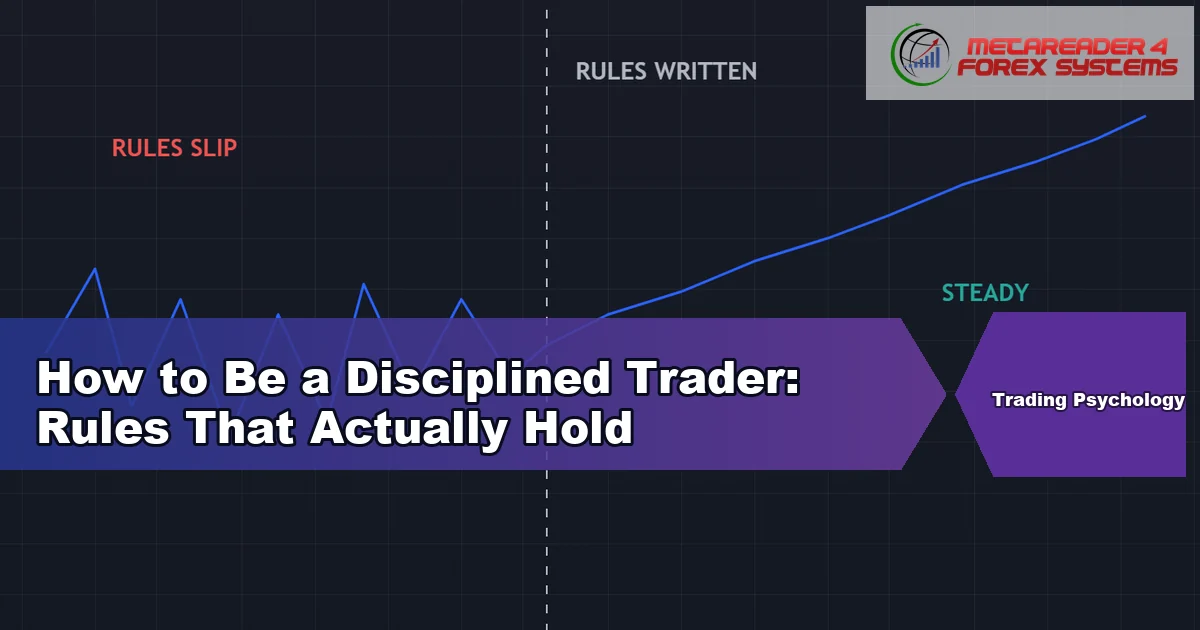
How to Be a Disciplined Trader: Rules That Actually Hold

how to be a disciplined trader - How to Be a Disciplined Trader: Rules That Actually Hold featured image

Discipline decides more trading outcomes than any indicator setting. Yet most advice on the subject stops at slogans. This guide answers how to be a disciplined trader with mechanics rather …

Leave a comment

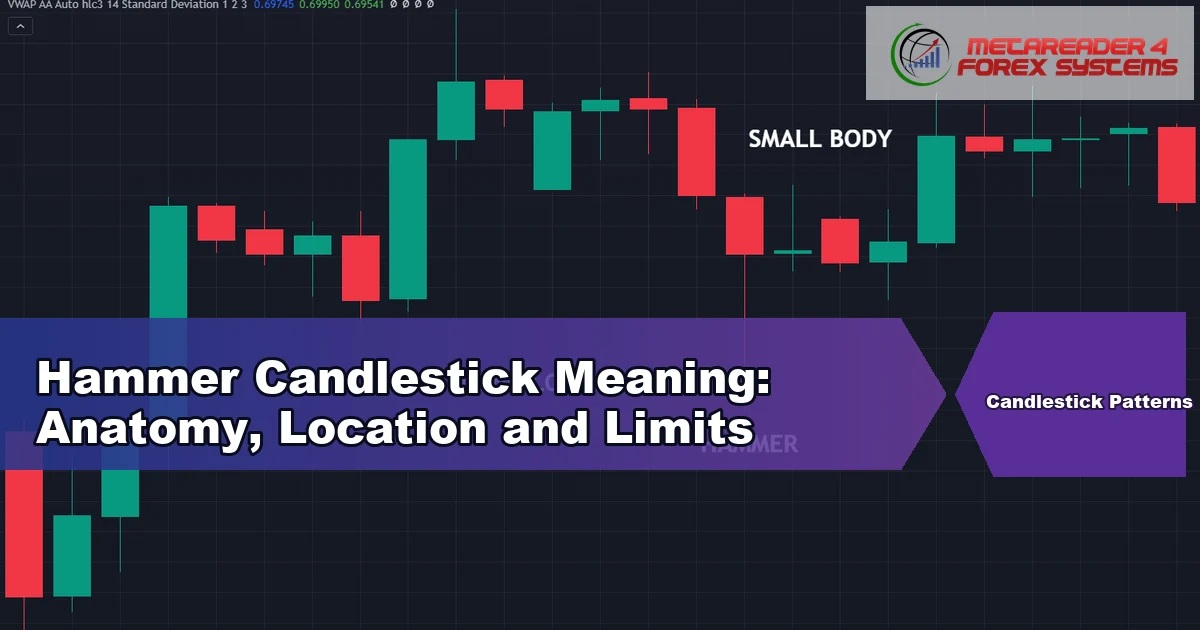
Hammer Candlestick Meaning: Anatomy, Location and Limits

hammer candlestick meaning - Hammer Candlestick Meaning: Anatomy, Location and Limits featured image

Most explanations of the hammer candlestick meaning stop at “it signals a reversal”, which is both vague and wrong. A hammer records what happened during one period, and the geometry …

Leave a comment

Fear of Taking a Trade: Why You Freeze and How to Fix It

fear of taking a trade - Fear of Taking a Trade: Why You Freeze and How to Fix It featured image

The fear of taking a trade arrives at the worst possible moment. Your setup prints, your plan says go, and your hand stops moving. This guide names the mechanism behind …

Leave a comment

Engulfing Candle Meaning: Bodies, Context and Failures

engulfing candle meaning - Engulfing Candle Meaning: Bodies, Context and Failures featured image

Ask ten traders for the engulfing candle meaning and you will hear ten slightly different definitions. Some measure bodies, some measure wicks, and the disagreement changes which bars qualify. This …

Leave a comment

Emotions in Trading: How a Feeling Becomes an Order

emotions in trading - Emotions in Trading: How a Feeling Becomes an Order featured image

Emotions in trading do not ruin accounts by themselves. They ruin accounts by changing an order that was already written down. This guide treats emotions in trading as a mechanical …

Leave a comment

Doji Candle Meaning: What the Thin-Bodied Bar Shows

doji candle meaning - Doji Candle Meaning: What the Thin-Bodied Bar Shows featured image

Doji candle meaning starts with one geometric fact. The open and the close finish at effectively the same price, so the body shrinks to a thin line. Everything else about …

Leave a comment

Demo vs Live Trading Psychology: Why Results Change

demo vs live trading psychology - Demo vs Live Trading Psychology: Why Results Change featured image

Plenty of traders build a beautiful practice record and then lose money in week one of a real account. Nothing about the strategy changed. The gap sits in demo vs …

Leave a comment

How to Deal With Trading Losses: A Practical Routine

how to deal with trading losses - How to Deal With Trading Losses: A Practical Routine featured image

Every trading method produces losses. The difference between accounts is not whether losses arrive, but what the trader does in the twenty minutes afterwards. This guide covers how to deal …

Leave a comment

Cognitive Biases in Trading: The Ten That Cost the Most

cognitive biases in trading - Cognitive Biases in Trading: The Ten That Cost the Most featured image

Cognitive biases in trading are the quiet reason a sound plan still loses money. They act on everyone, and they rarely feel like errors while they happen. This guide walks …

Leave a comment

Analysis Paralysis in Trading: How to Break the Freeze

analysis paralysis in trading - Analysis Paralysis in Trading: How to Break the Freeze featured image

You mark the setup, then check one more timeframe. Then a second indicator, then a news feed, and by the time you are satisfied the move has already run. Analysis …

Leave a comment

Why Do Traders Lose Money? The Evidence and the Causes

why do traders lose money - Why Do Traders Lose Money? The Evidence and the Causes featured image

Ask why do traders lose money and you will meet a famous round percentage within seconds. That number circulates everywhere and cites almost nothing. The honest picture looks different, and …

Leave a comment

What Is Trading Psychology? A Trader’s Practical Guide

what is trading psychology - What Is Trading Psychology? A Trader's Practical Guide featured image

Ask what is trading psychology and most answers arrive as slogans. A sharper answer starts with behavioral finance, the field that measures how people really decide under risk. This guide …

Leave a comment

Fifteen Trading Psychology Tips That Hold Up Under Pressure

trading psychology tips - Fifteen Trading Psychology Tips That Hold Up Under Pressure featured image

Most trading psychology tips fail the moment a session turns ugly. They ask you to feel calm exactly when calm has left the building. So this guide takes a different …
Leave a comment
Older posts
Newer posts
← Previous Page1 … Page3 Page4 Page5 … Page9 Next →
TradingView charts and trading platform
Instant Funding Master funded trading account offer
Cashback Forex broker rebates

Risk Disclosure: Trading futures and foreign exchange carries a high degree of risk and is not appropriate for everyone. You may lose part, all, or more than the funds you commit. Trade only with risk capital — money you can afford to part with without harming your financial stability or way of life. If you do not hold surplus capital of this kind, you should not trade these markets. Past performance is not necessarily indicative of future results.

Hypothetical Performance Disclosure: Simulated or hypothetical results carry built-in limitations, several of which are noted here. No claim is made that any account has achieved or is likely to achieve gains or losses comparable to those shown; in practice, live outcomes often diverge sharply from modelled ones. A key shortcoming of hypothetical figures is that they are usually constructed after the fact, with full knowledge of how the market moved. Back-tested trading also puts no real money on the line, so no simulated record can fully reflect how financial risk shapes live decisions. A trader's capacity to absorb drawdowns, or to keep following a system through a losing streak, materially affects real returns and cannot be reproduced in a model. Many further market and execution variables likewise escape any hypothetical calculation, and each can work against actual trading performance.

Testimonials Disclosure: Comments or reviews shown on this site reflect individual experiences and may not match the results of other visitors or customers. They are not a promise of future performance or success.

General Disclosure & Limitation of Liability: FOREXMT4SYSTEMS.COM publishes all material for educational and informational purposes only and accepts no liability for trading losses or for any decisions taken on the basis of this content. We may receive compensation through advertising, affiliate partnerships, or product sales; this never compromises our editorial independence or transparency. Trading carries risk, and past performance does not assure future results.
About · Author: Dominic Walsh · Contact · Editorial & Testing Policy · Disclaimer · Privacy · All Indicators A-Z · Install Guide

Copyright © 2026 FOREXMT4SYSTEMS.COM