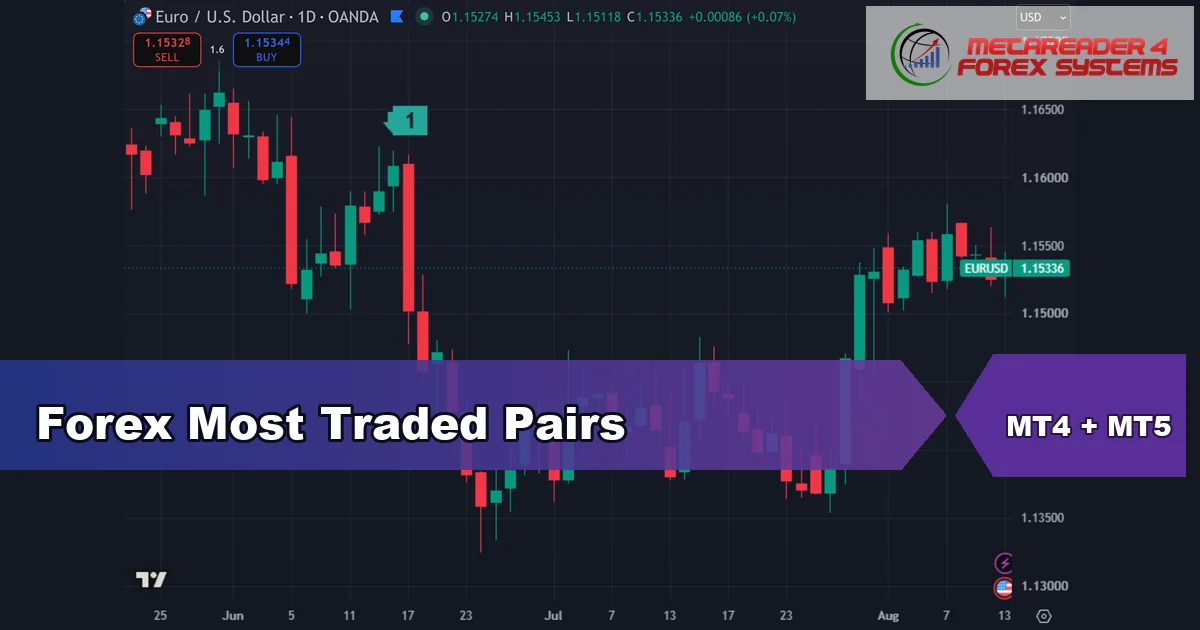
The forex most traded pairs are a short list. Seven pairs carry the bulk of a market turning over roughly 7.5 trillion dollars a day, and the reason matters more …
Bid ask spread calculation is one subtraction, and it decides more of your results than most indicators do. The bid is what a buyer will pay you. The ask is …
Line charts in forex plot one number per period: the closing price. The format discards everything else the market did during that period. That sounds like a loss, and often …
The difference in IFVG vs FVG is one event: whether price broke through the gap or respected it. A fair value gap is an unfilled three-bar imbalance that often acts …
The best MACD setting for swing trading is usually the one you already have. The default 12-26-9 was designed for daily charts held over days and weeks, which is exactly …
Bar chart vs candlestick is a smaller decision than it looks. Both plot exactly the same four numbers for each period: open, high, low and close. Neither adds or hides …
This harmonic pattern cheat sheet gives you the exact Fibonacci ratios for every major shape in one place, plus the checks that separate a valid pattern from a drawing that …
Elliott wave EURUSD analysis means labelling the pair’s swings into the five-three sequence Ralph Nelson Elliott described in the 1930s. Done carefully it gives you a map of where the …
Volume spread analysis reads three things on every bar and asks whether they agree. The three are the spread, meaning the height of the bar, the position of the close …
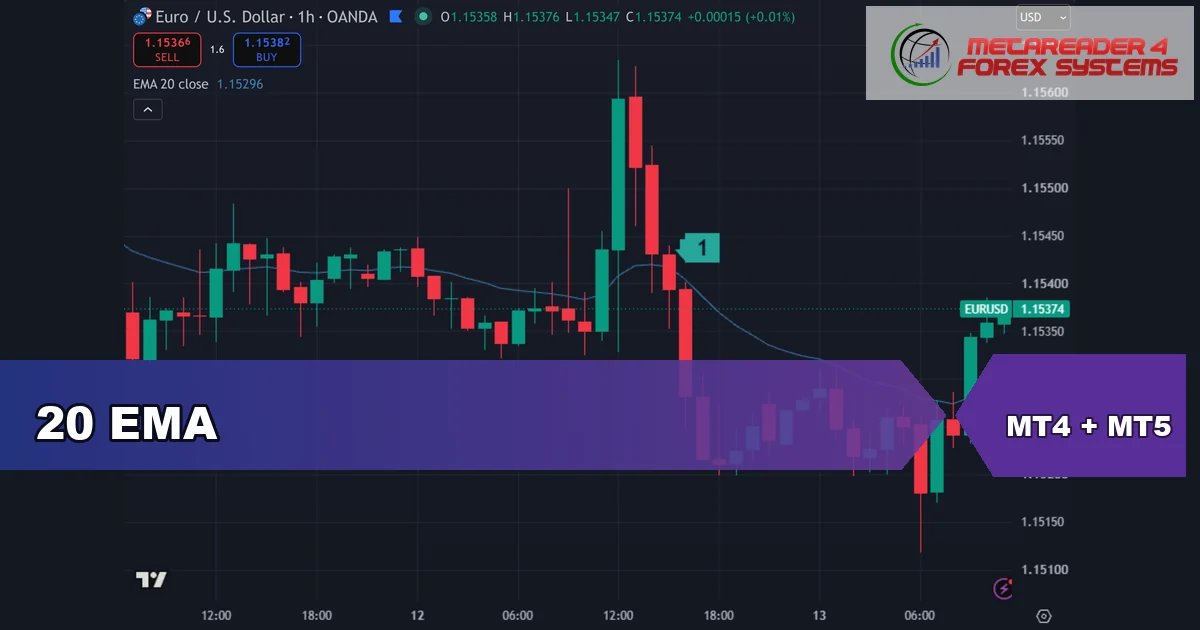
The 20 EMA is the short-term trend line most traders reach for first. It sits close enough to price to be useful intraday, yet far enough away to filter ordinary …
MACD scalping settings trade signal count for speed. The default 12-26-9 was designed for daily charts, so on an M1 or M5 chart it reacts late and gives back much …
Traders searching for forex news factory are usually after one thing: the economic calendar that tells them when the market is about to move. The calendar lists scheduled releases, ranks …
Here is the honest answer up front. You cannot load the custom indicators MT4 mobile traders keep searching for. The mobile apps do not support them. The MT4 and MT5 …
A parabolic chart can mean two different things, so this guide covers both. Traders use the word for a price move that speeds up until it looks almost vertical. They …
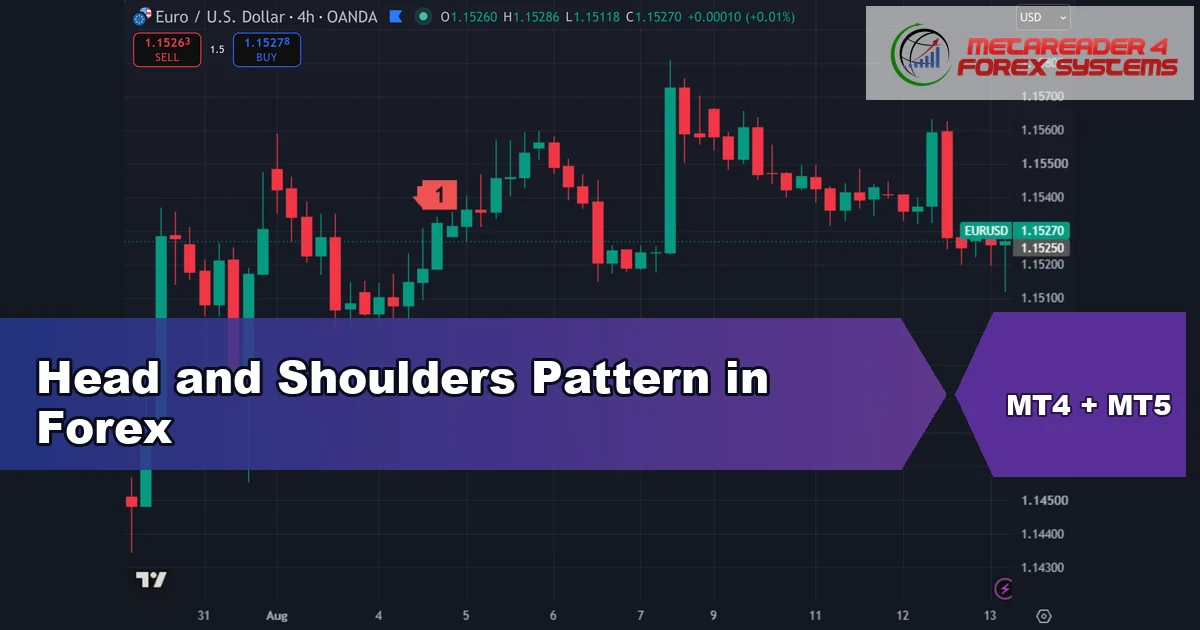
The head and shoulders pattern is a three-peak reversal formation that warns an uptrend may be ending. The first peak is the left shoulder. A taller peak forms the head. …
A breaker block is an order block that failed. Price traded back through the zone that was supposed to hold, so the traders who bought or sold there are now …
ICT times are the narrow session windows that Inner Circle Trader followers call kill zones. The idea is simple: volatility and volume cluster around session opens, so most of the …
SMC trading, short for Smart Money Concepts, reads a price chart as a record of where large institutional orders were filled. Rather than asking an indicator for a buy signal, …
Forex pair volatility is simply how far a pair tends to travel in a given period, usually measured in pips or by ATR. Some pairs drift. Others swing hard. That …
A pivot point calculator turns one session’s high, low and close into support and resistance levels for the next session. The maths is plain arithmetic, and you can run it …
An inverse FVG is a fair value gap that price has traded straight through instead of respecting. When that happens the zone flips polarity: a bullish gap that fails becomes …
A compound interest calculator forex traders use runs one formula: A = P(1 + r)n. Start with the honest part, because it decides how much the output is worth. Trading …
Market liquidity describes how easily you can buy or sell a given size without pushing the price against yourself. Deep liquidity means your order fills close to the price you …
Tick scalping is a very short-term trading style that takes small, frequent profits. Its charts are built on transaction counts rather than clock time. Instead of a bar closing every …
A forex position sizing calculator answers one question: how many lots can I trade without risking more than I intended? It takes four inputs: your account balance, the percentage you …
A forex pips calculator turns a price move into money. You give it the pair, the lot size and your account currency, and it hands back the cash value of …
When does the forex market open? Trading begins at the Sydney open on Sunday evening, around 21:00–22:00 GMT, and runs without a break until the New York close on Friday …
In trading, a liquidity trap is a false move that lures traders onto the wrong side of the market before reversing against them. Price breaks a level, everyone piles in, …
A liquidity sweep happens when price pushes just beyond an obvious high or low, triggers the stop orders resting there, and then reverses back into the range it came from. …
A bullish divergence happens when price makes a lower low but the oscillator underneath makes a higher low. In plain terms, the market printed a fresh low without the selling …
The stochastic momentum index measures where price closed relative to the midpoint of the recent high-low range, instead of relative to the bottom of that range. That single change makes …
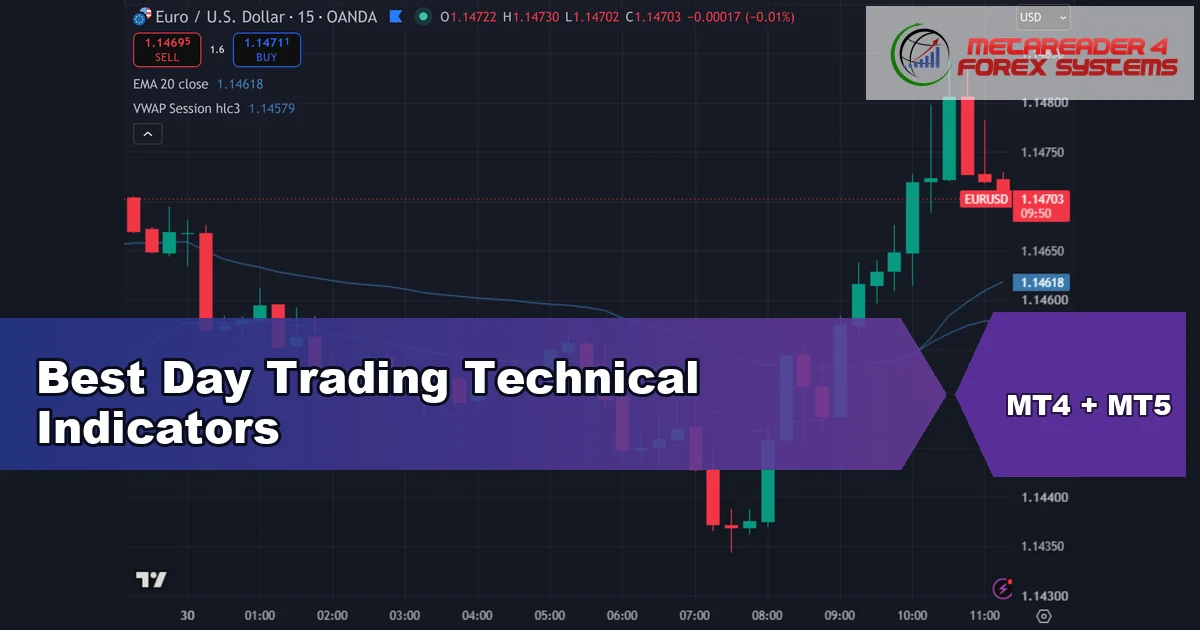
The best day trading indicators are the ones that each answer a different question: a moving average for trend, VWAP for session fair value, RSI and MACD for momentum, Bollinger …
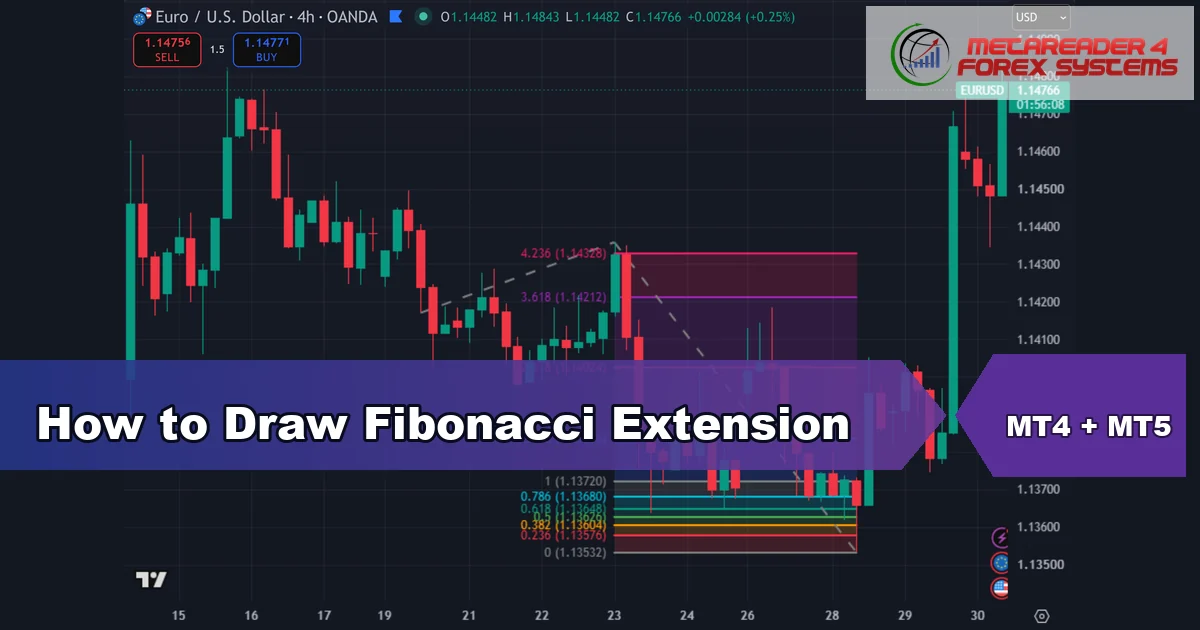
To draw a Fibonacci extension, you plot three points in order: the swing low, the swing high, then the retracement pullback. The tool projects profit targets beyond that move, at …
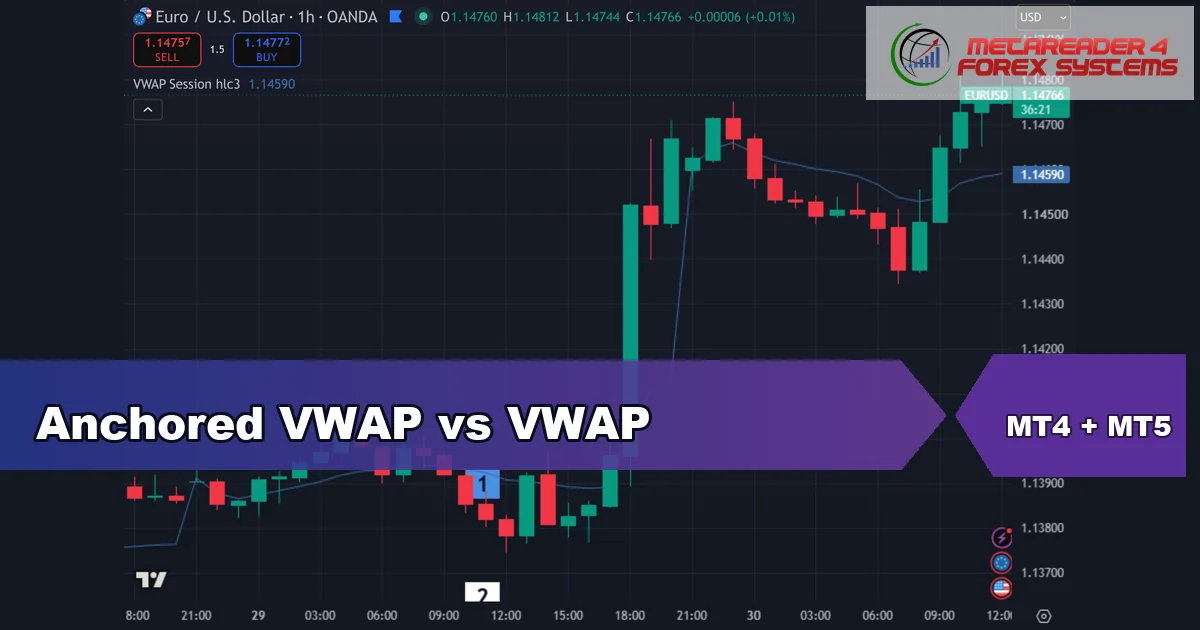
The anchored VWAP vs VWAP question comes down to one thing: where the calculation starts. Both plot the volume-weighted average price — the average price of every trade, weighted by …
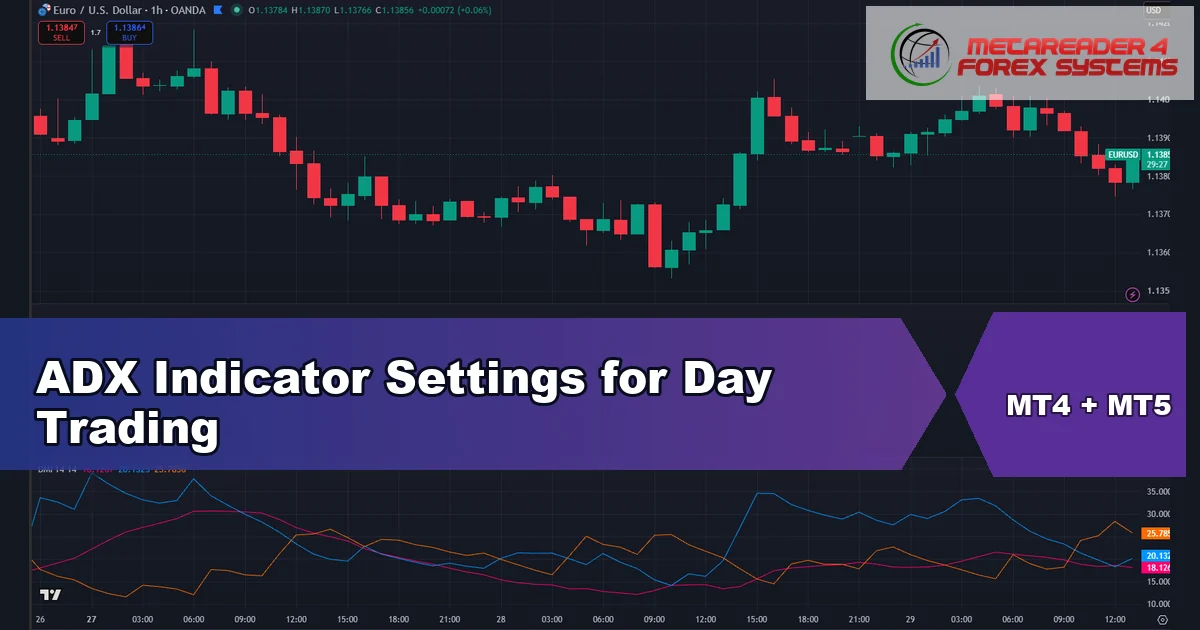
The default ADX indicator settings are a 14-period length, the number Welles Wilder chose when he built the tool. Day traders often shorten that to 7 to 10 for faster …
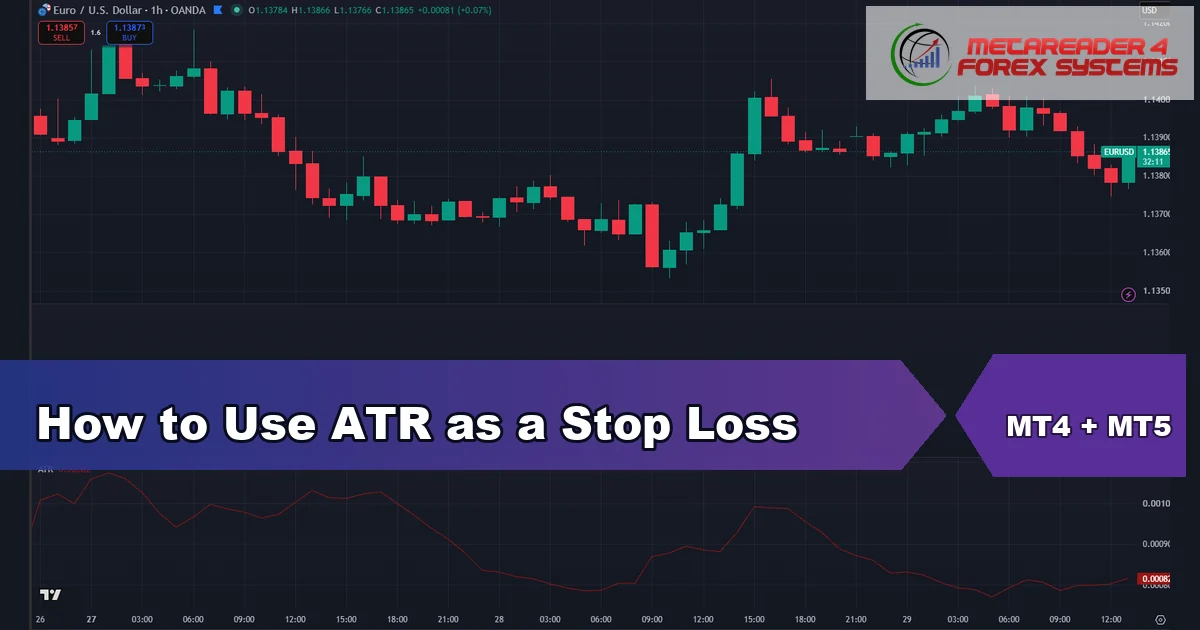
An ATR stop loss places your stop a set multiple of the Average True Range away from your entry, so the distance adapts to how much a pair actually moves. …
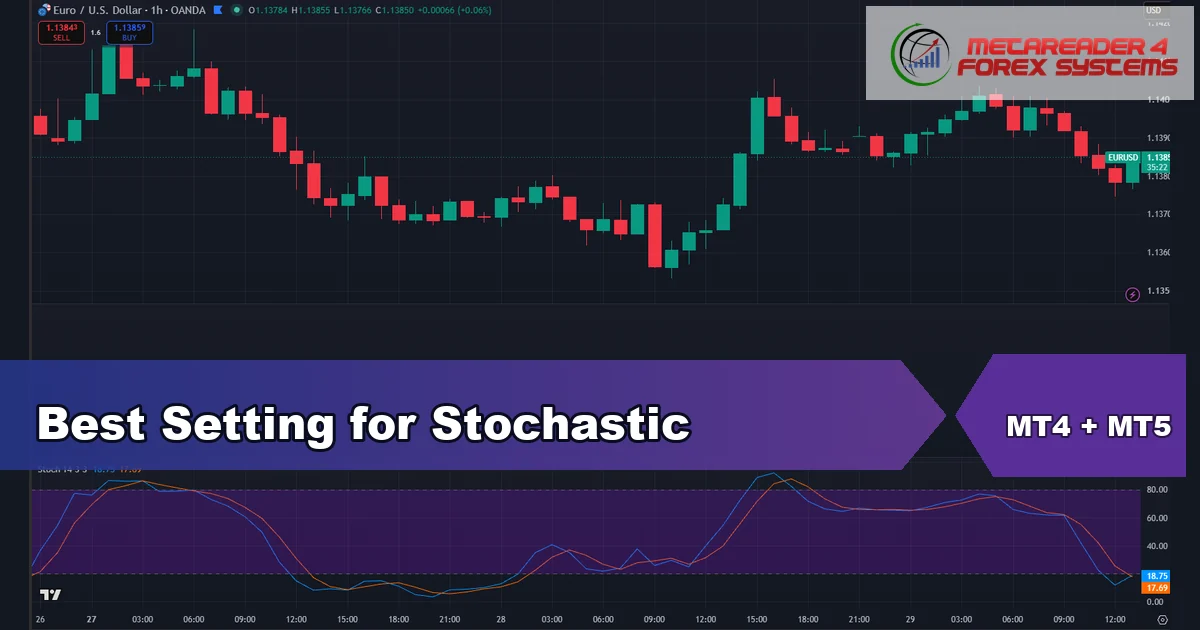
The best stochastic settings for most traders are the classic 14, 3, 3. Those three numbers control the lookback, the smoothing and the signal line. They suit day trading on …
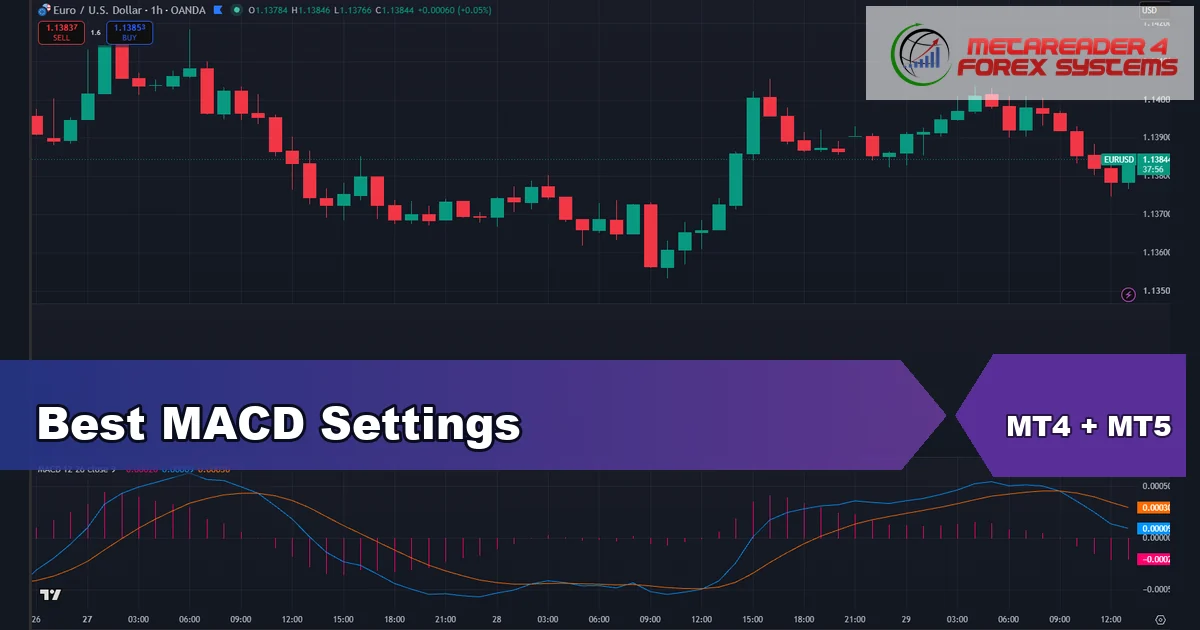
The best MACD settings for most traders are the classic 12, 26, 9 — a 12-period fast EMA, a 26-period slow EMA and a 9-period signal line. Those numbers still …
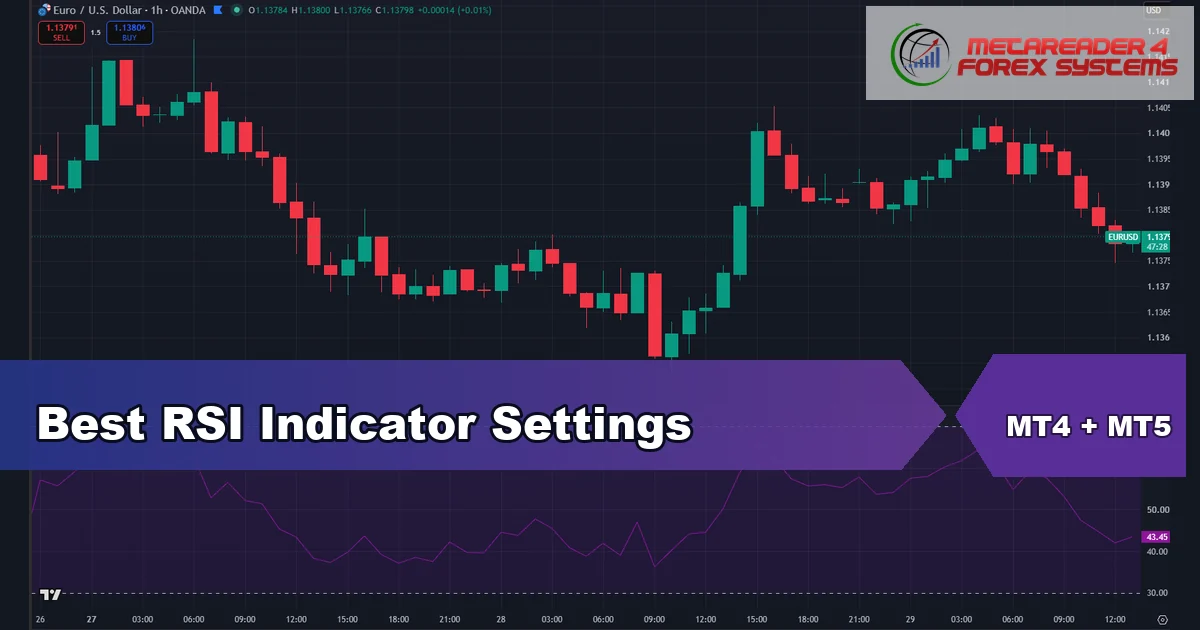
The best RSI indicator settings for most traders are the default 14-period lookback, with overbought at 70 and oversold at 30. Those numbers suit almost every pair and timeframe. Still, …
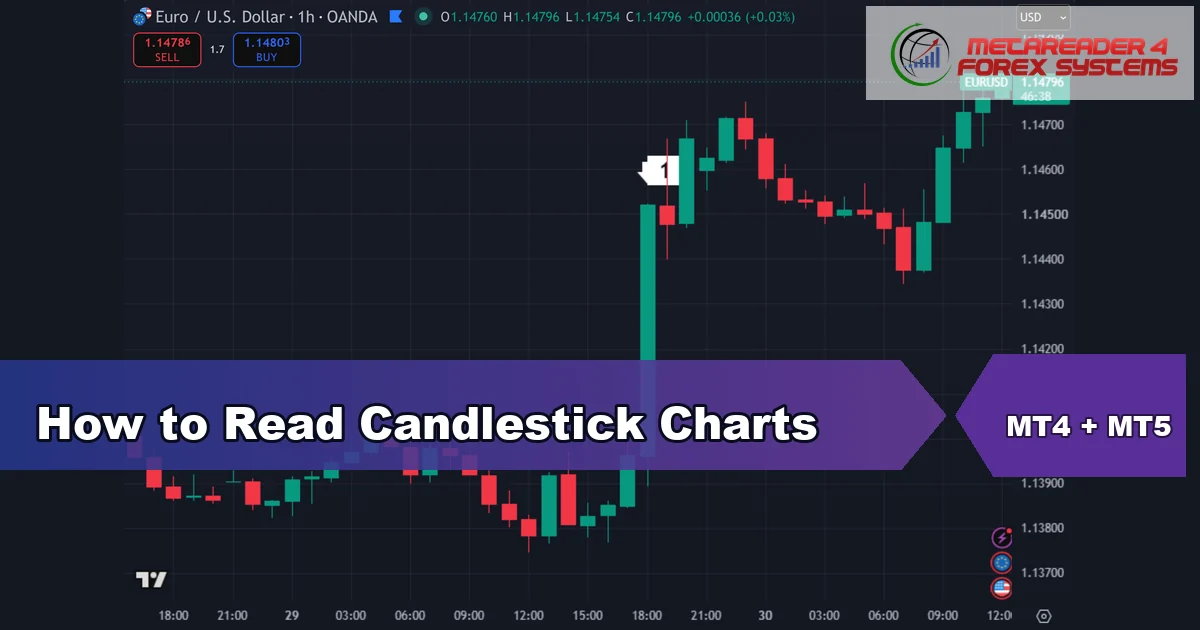
To read a candlestick chart, focus on four prices in every candle: the open, the high, the low and the close. The thick body shows where price opened and closed. …
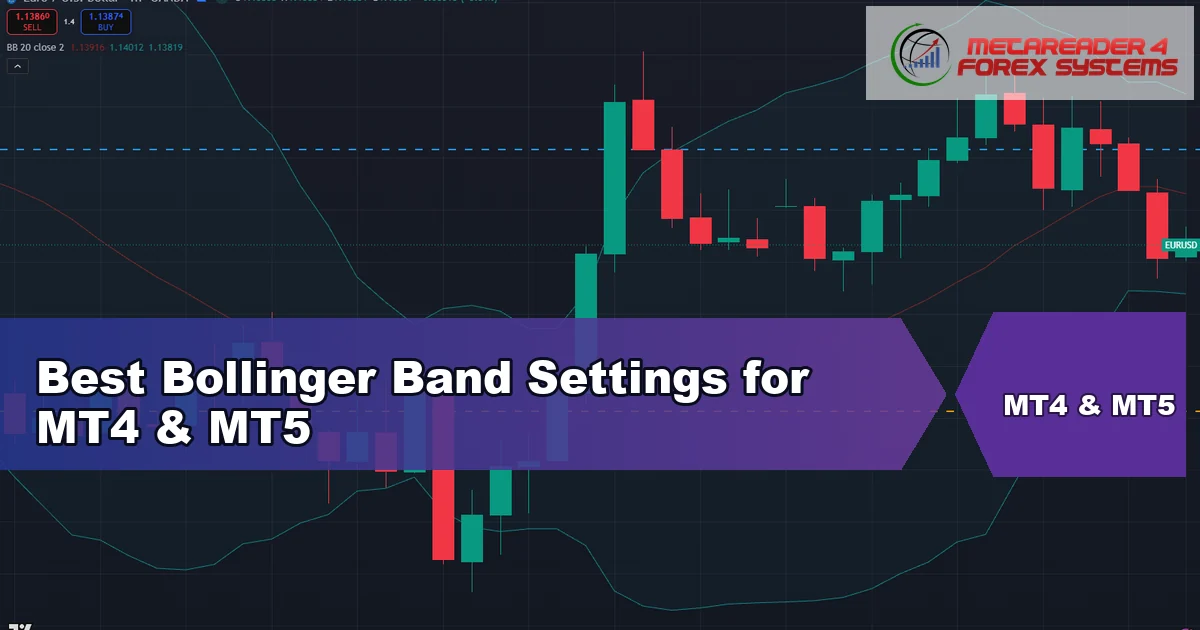
The best Bollinger Band settings for most traders are the classic 20-period length with a 2.0 standard deviation. The right numbers, though, depend on how you trade. Scalpers tighten the …