Skip to content
  • About Us
  • Contact Us
  • Privacy Policy
  • Disclaimer
  • Install Guide
  • Editorial Policy
ForexMT4Systems
  • Indicators
    • MT4 Indicators
    • MT5 Indicators
    • AI
    • Bands and Channels
    • Binary Options
    • Breakout
    • Candle Sticks
    • Currency Strength
    • Cycles
    • Elliott Wave
    • Fibonacci
    • Gann
    • Harmonic
    • Heatmap
    • ICT
    • Ichimoku
    • Intraday
    • Levels
    • Liquidity
    • MACD
    • Momentum
    • Moving Average
    • Multi-Timeframe
    • News
    • Non-Repaint
    • Order Book
    • Order Flow
    • Oscillators
    • Overbought and Oversold
    • Pattern Recognition
    • Pivot Points and Fractals
    • Price Action
    • RSI
    • Range
    • Reversal
    • Risk Management
    • Scalper
    • Sessions
    • Signal and Forecast
    • Smart Money
    • Supply and Demand
    • Support and Resistance
    • Swing Trading
    • Trend
    • VWAP
    • Volatility
    • Volume
    • Volume Profile
    • ZigZag
  • Expert Advisors
  • Scripts
  • TradingView
    • All Free TradingView Indicators
    • Premium TradingView Indicators
  • Strategies
    • Forex
    • Breakout
    • Day Trading
    • ICT and SMC
    • Mean Reversion
    • News
    • Position
    • Price Action
    • Scalping
    • Swing
  • Guides
    • Best Indicators
    • Comparisons
    • How-To Guides
    • Indicator Settings
    • Currency Pairs
    • Timeframes
  • Education
    • Smart Money Concepts
    • Technical Analysis
    • Forex Basics
    • Risk Management
    • Prop Firm Trading
    • Trading Psychology
    • Candlestick Patterns
    • Chart Patterns
    • Fundamental Analysis
    • Trading Styles
    • Trading Plan and Journal
    • Order Types and Execution
    • Automated and Copy Trading
    • Market Sentiment
    • Forex Brokers
    • Backtesting and Systems
  • Tools
    • Position Size Calculator
    • Pip Value Calculator
    • Profit Calculator
    • Risk Reward Calculator
    • Trading Journal
    • Economic Calendar
    • Market Hours Clock
    • Forex Heatmap
    • View All 41 tools ->

Guides

Practical, tested guides for trading with MT4 and MT5 indicators.

When to Buy and Sell on Forex: The Hours That Move, Measured

when to buy and sell on forex - When to Buy and Sell on Forex: The Hours That Move, Measured

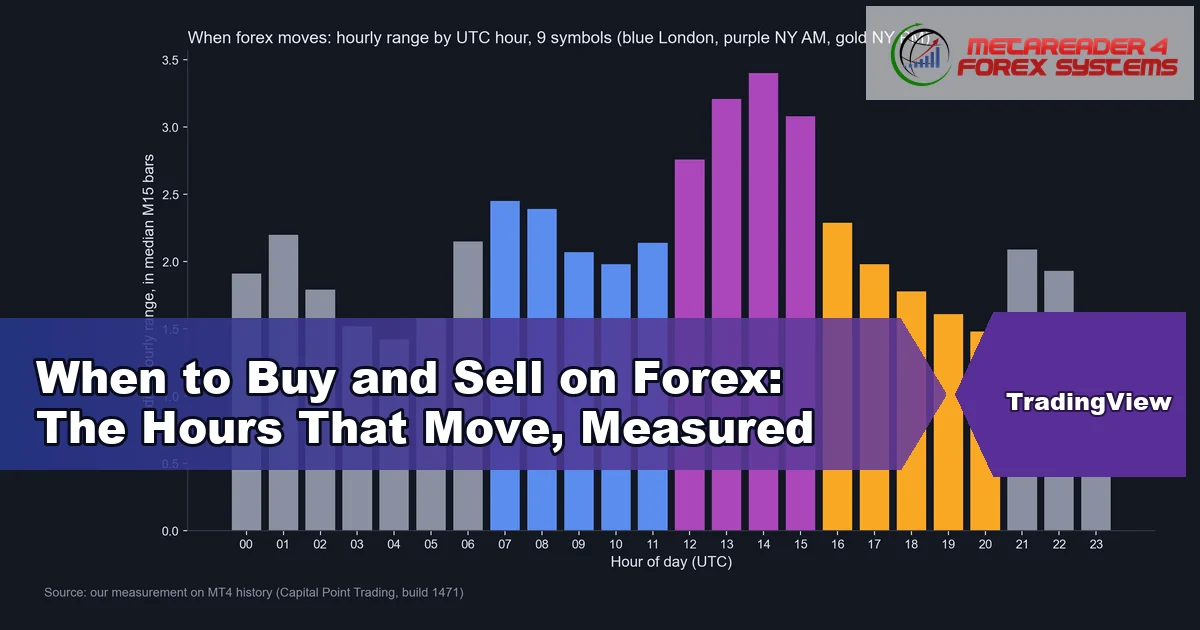
When to buy and sell on forex is really a question about time: which hours of the day the market actually moves, and which hours it mostly sits still. We …

Leave a comment

Propulsion Block ICT: How It Forms and How Often It Held

propulsion block ict - Propulsion Block ICT: How It Forms and How Often It Held

A propulsion block ICT setup is an order block that forms inside an earlier order block and then launches price away. This guide settles three things: what the pattern looks …

Leave a comment

ICC vs ICT Trading: What Each Is and How ICC Tested on 23 Pairs

icc vs ict trading - ICC vs ICT Trading: What Each Is and How ICC Tested on 23 Pairs

ICC vs ICT trading is a question about two very different things: ICC is a three-step entry pattern, while ICT is a whole vocabulary of price ideas. ICC stands for …

Leave a comment

Volume Footprint TradingView: How to Read It on Forex Charts

volume footprint tradingview - Volume Footprint TradingView: How to Read It on Forex Charts

The volume footprint TradingView chart type splits every candle into price rows and prints how much volume traded at each row, divided into a buy side and a sell side. …

Leave a comment

Volume Candlestick Chart: What Candle Width Shows in Forex

volume candlestick chart - Volume Candlestick Chart: What Candle Width Shows in Forex

A volume candlestick chart draws each candle with a width that grows with the volume traded in that bar, so price and activity sit in one picture. This guide settles …

Leave a comment

Zigzag Formula: Deviation, Depth and Backstep Explained

zigzag formula - Zigzag Formula: Deviation, Depth and Backstep Explained

The zigzag formula is simple: a new swing starts only after price turns back by a set amount from the last high or low. This guide settles three things. First, …

Leave a comment

Is Semafor Left or Right? Where the Dots Repaint, Measured

is semafor left or right - Is Semafor Left or Right? Where the Dots Repaint, Measured

Is Semafor left or right when it repaints? The answer is right. A Semafor dot can move, vanish or reappear only on the newest bars at the right edge of …

Leave a comment

RSI Color Code: What Red, Green and Grey Mean (Tested)

rsi color code - RSI Color Code: What Red, Green and Grey Mean (Tested)

An RSI color code is a simple key: red when the RSI is above 70, green when it is below 30, and grey for everything in between. This guide settles …

Leave a comment

Daily Forex Pips: How Far 23 Pairs Move in a Day, Measured

daily forex pips - Daily Forex Pips: How Far 23 Pairs Move in a Day, Measured

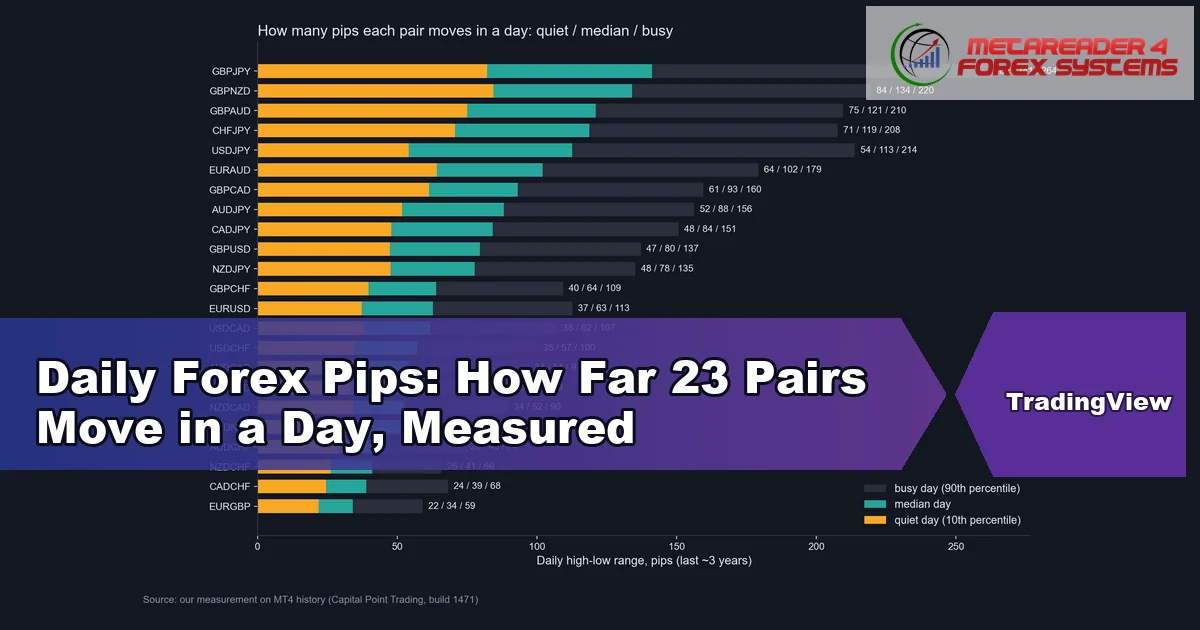
Daily forex pips is the number of pips a currency pair travels from its daily low to its daily high. We measured it on 23 pairs over the last 750 …

Leave a comment

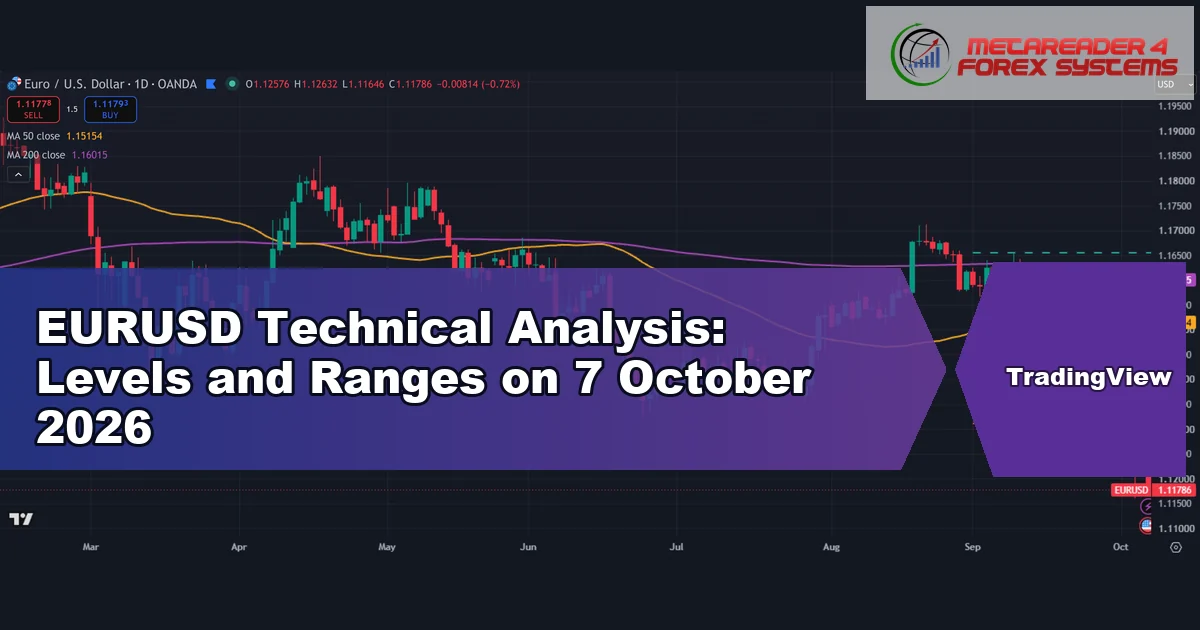
EURUSD Technical Analysis: Levels and Ranges on 7 October 2026

eurusd technical analysis - EURUSD Technical Analysis: Levels and Ranges on 7 October 2026

EURUSD technical analysis is a structured read of the euro-dollar chart: where price sits against its averages, its recent highs and lows, and its normal daily range. This guide settles …

Leave a comment

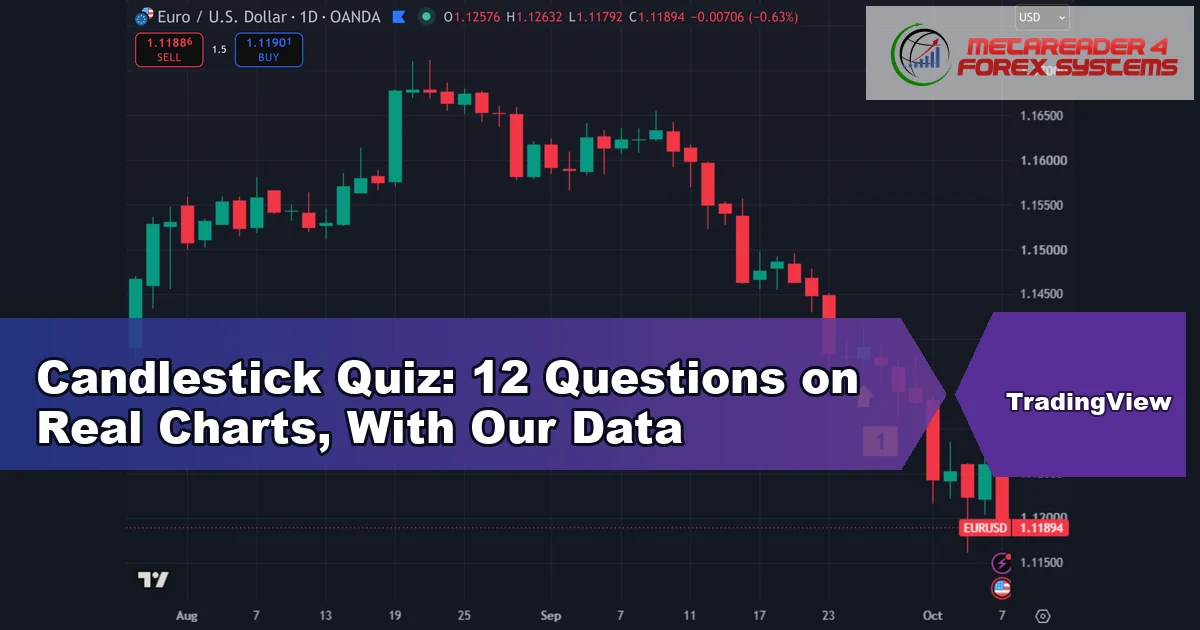
Candlestick Quiz: 12 Questions on Real Charts, With Our Data

candlestick quiz - Candlestick Quiz: 12 Questions on Real Charts, With Our Data

This candlestick quiz uses six real charts and six short definition questions to test whether you can name a pattern when it appears on a live chart. Each answer sits …

Leave a comment

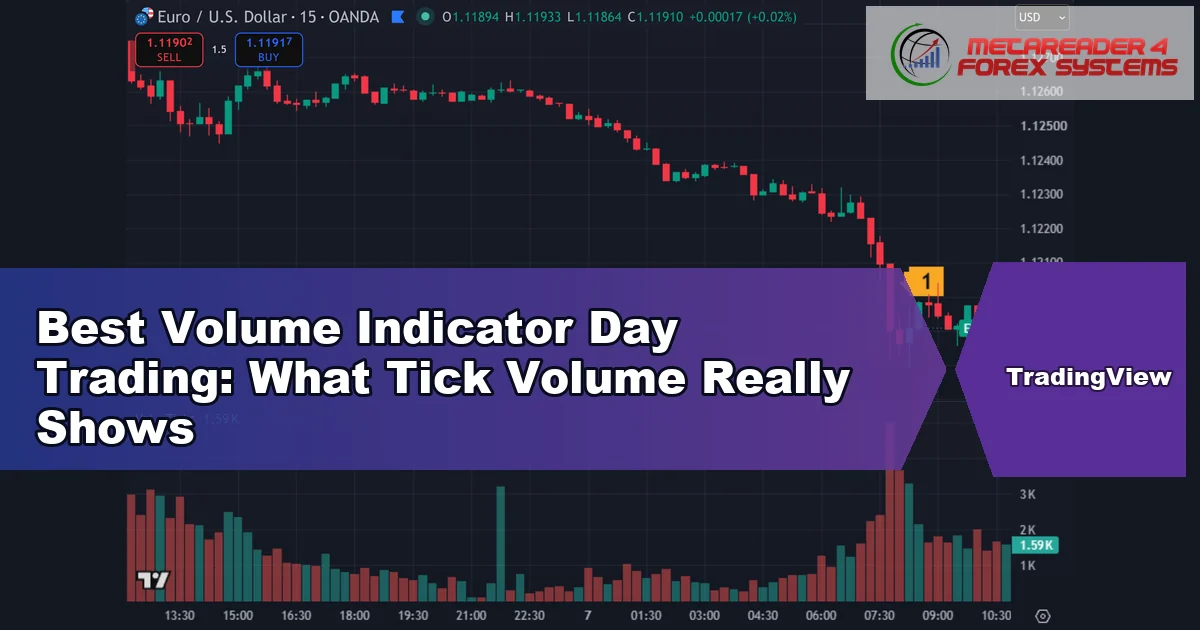
Best Volume Indicator Day Trading: What Tick Volume Really Shows

best volume indicator day trading - Best Volume Indicator Day Trading: What Tick Volume Really Shows

The best volume indicator day trading choice depends on the question you ask the chart, because each tool answers a different one. In spot forex there is no central tape, …

Leave a comment

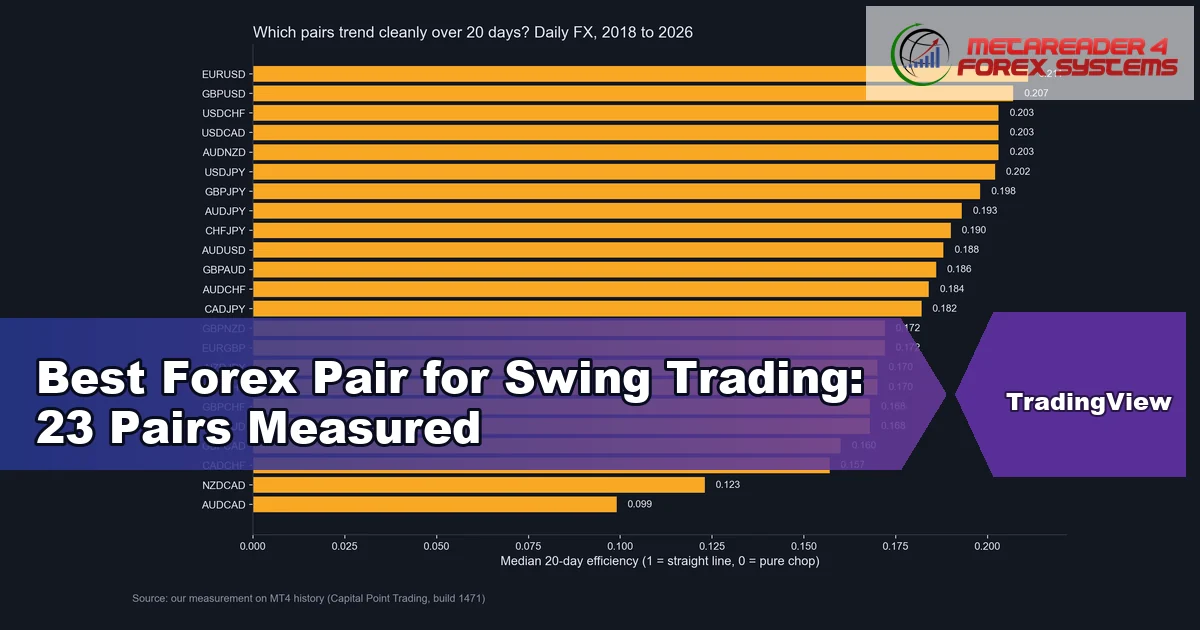
Best Forex Pair for Swing Trading: 23 Pairs Measured

best forex pair for swing trading - Best Forex Pair for Swing Trading: 23 Pairs Measured

The best forex pair for swing trading is not one fixed symbol, and anyone who names a single winner is skipping the trade-offs. So we measured instead. We took eight …

Leave a comment

MACD Zero Line: What 1,353 Daily FX Crosses Really Showed

macd zero line - MACD Zero Line: What 1,353 Daily FX Crosses Really Showed

The MACD zero line is the level where the MACD line changes sign, because the 12-period EMA has crossed the 26-period EMA. This guide settles one question with data: does …

Leave a comment

3 Bar Reversal Pattern TradingView: Rule, Code and Test Data

3 bar reversal pattern tradingview - 3 Bar Reversal Pattern TradingView: Rule, Code and Test Data

The 3 bar reversal pattern TradingView users mark is a three-candle turn: a push, a new extreme, then a close back through that extreme. This guide settles three things. First, …

Leave a comment

Renko Trading: How Bricks Work and What Our Test Showed

renko trading - Renko Trading: How Bricks Work and What Our Test Showed

Renko trading means reading price from bricks of a fixed size instead of from time-based candles. A new brick prints only when price moves a set distance, so quiet hours …

Leave a comment

IPDA ICT: 20, 40 and 60-Day Ranges Tested on 23 Pairs

ipda ict - IPDA ICT: 20, 40 and 60-Day Ranges Tested on 23 Pairs

IPDA ICT is the label ICT traders use for the 20, 40 and 60-day look-back ranges they mark on a daily chart. This guide settles two things. First, what the …

Leave a comment

ICT Standard Deviation: How Often Price Reaches the Levels

ict standard deviation - ICT Standard Deviation: How Often Price Reaches the Levels

ICT standard deviation is a way to project price targets by stacking copies of a reference range above and below it, usually at 1, 2, 2.5 and 4 times its …

Leave a comment

Breakaway Gap ICT: How Often FVGs Stay Unfilled (Tested)

breakaway gap ict - Breakaway Gap ICT: How Often FVGs Stay Unfilled (Tested)

A breakaway gap ICT traders talk about is a fair value gap that price never comes back to fill. This guide settles three things. First, what the term means in …

Leave a comment

Supply and Demand Strategy: One Zone Rule Tested on 23 Pairs

supply and demand strategy - Supply and Demand Strategy: One Zone Rule Tested on 23 Pairs

A supply and demand strategy trades the price areas where a fast move started, on the idea that unfilled orders still wait there. This guide turns that idea into one …

Leave a comment

TradingView Market Replay: How Bar Replay Works, Tested

tradingview market replay - TradingView Market Replay: How Bar Replay Works, Tested

TradingView market replay is the Bar Replay tool: it hides every bar after a date you pick, then plays the chart forward one update at a time. This guide shows …

Leave a comment

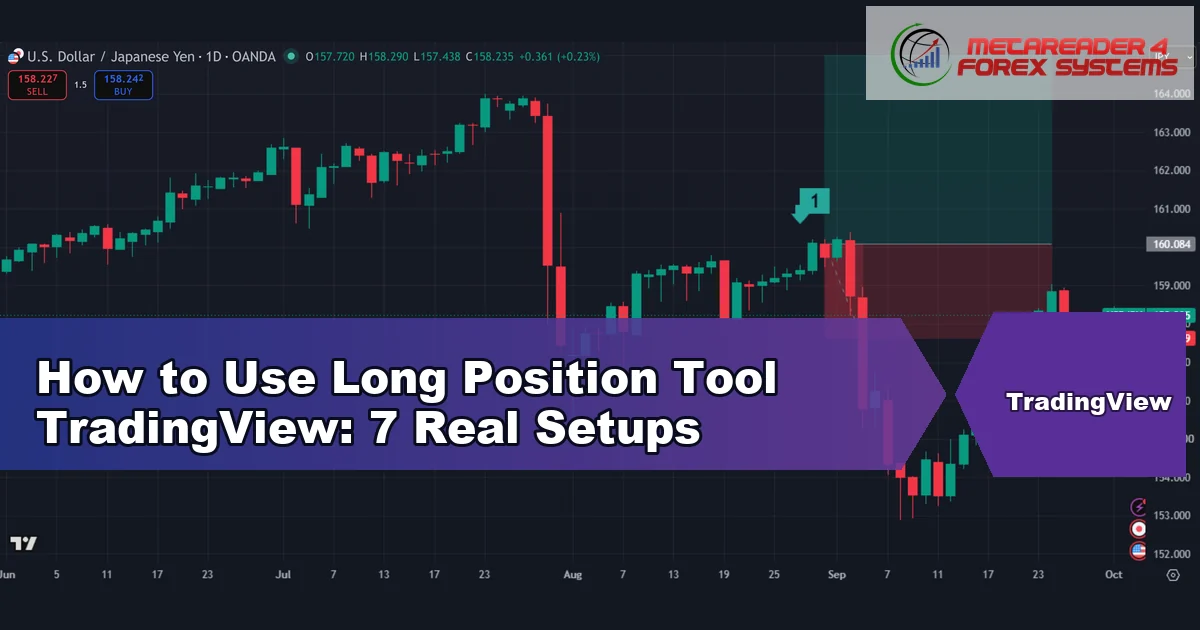
How to Use Long Position Tool TradingView: 7 Real Setups

how to use long position tool tradingview - How to Use Long Position Tool TradingView: 7 Real Setups

This guide covers how to use long position tool TradingView drawings to plan a trade before you take it. You get the toolbar location, every field in the settings dialog, …

Leave a comment

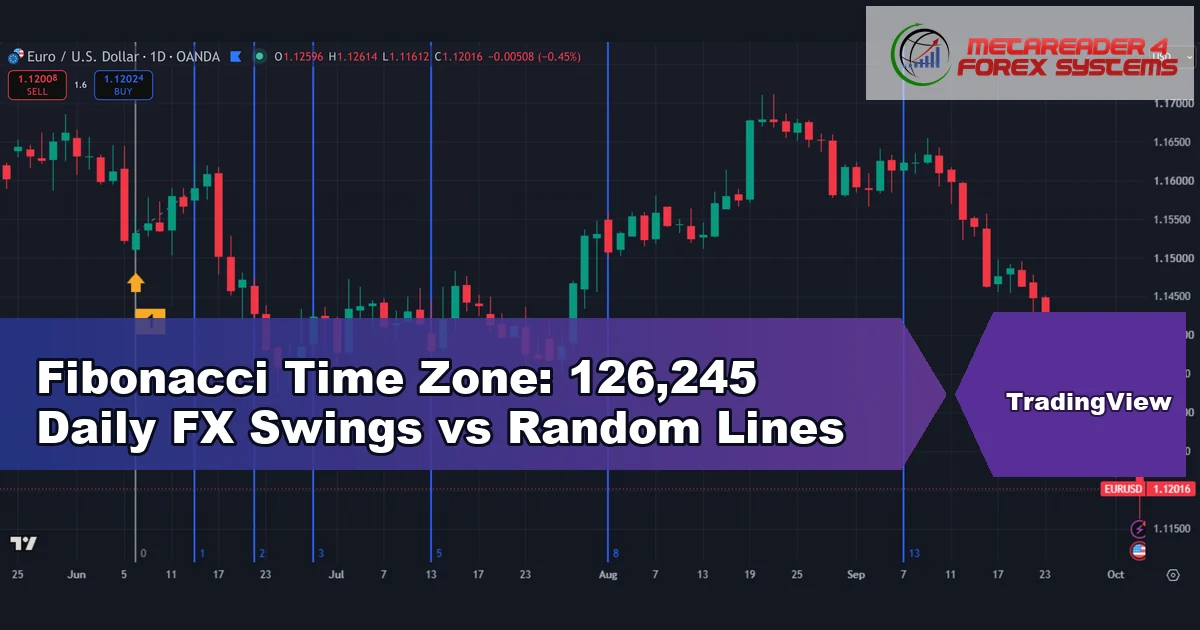
Fibonacci Time Zone: 126,245 Daily FX Swings vs Random Lines

fibonacci time zone - Fibonacci Time Zone: 126,245 Daily FX Swings vs Random Lines

A Fibonacci time zone is a set of vertical lines that runs forward from one swing on a chart, spaced at Fibonacci multiples of a chosen gap. The claim behind …

Leave a comment

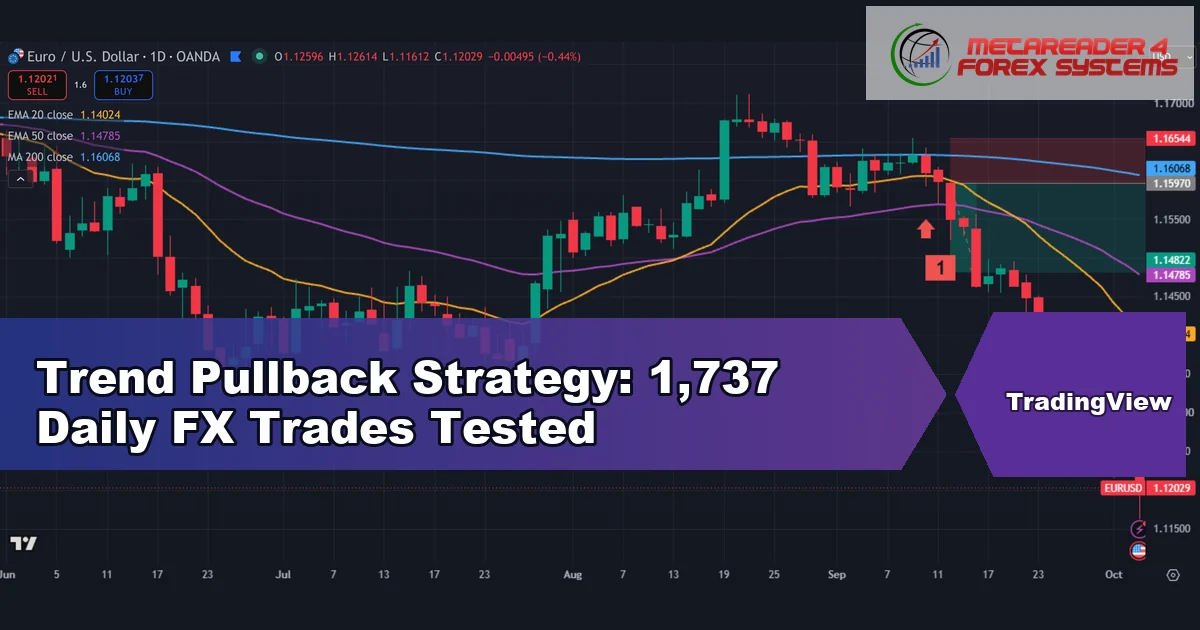
Trend Pullback Strategy: 1,737 Daily FX Trades Tested

trend pullback strategy - Trend Pullback Strategy: 1,737 Daily FX Trades Tested

A trend pullback strategy buys a dip inside an uptrend, or sells a bounce inside a downtrend, and then rides the trend’s next leg. We wrote one version as an …

Leave a comment

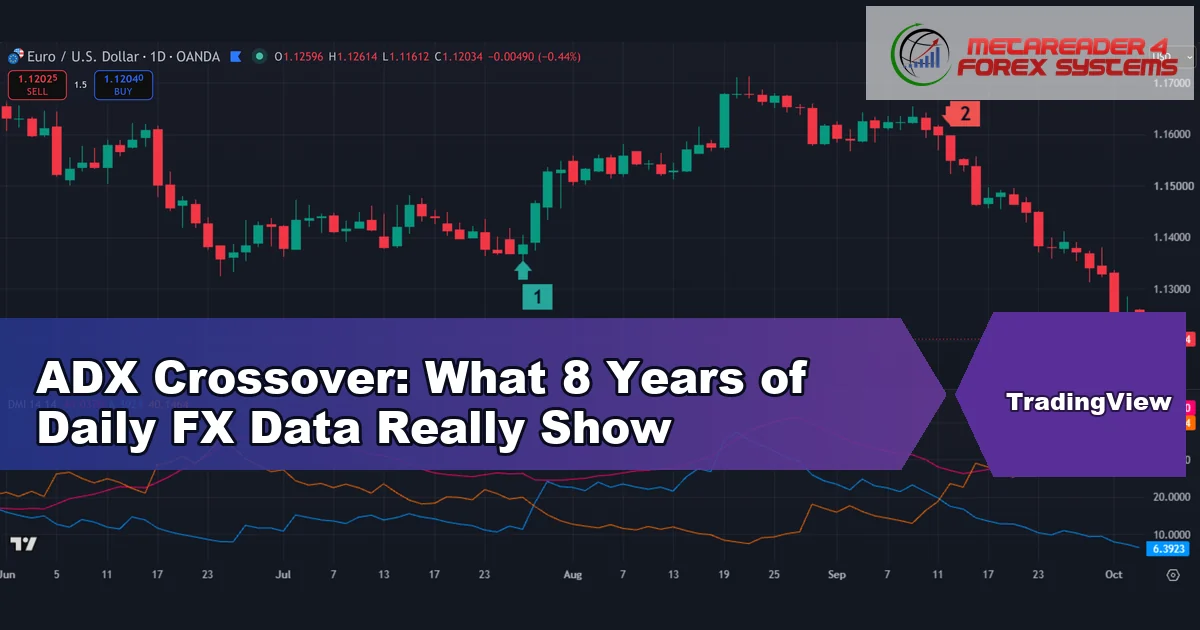
ADX Crossover: What 8 Years of Daily FX Data Really Show

adx crossover - ADX Crossover: What 8 Years of Daily FX Data Really Show

An ADX crossover is the moment the +DI line crosses the -DI line on the Directional Movement study, usually read with the ADX line as a strength filter. This guide …

Leave a comment

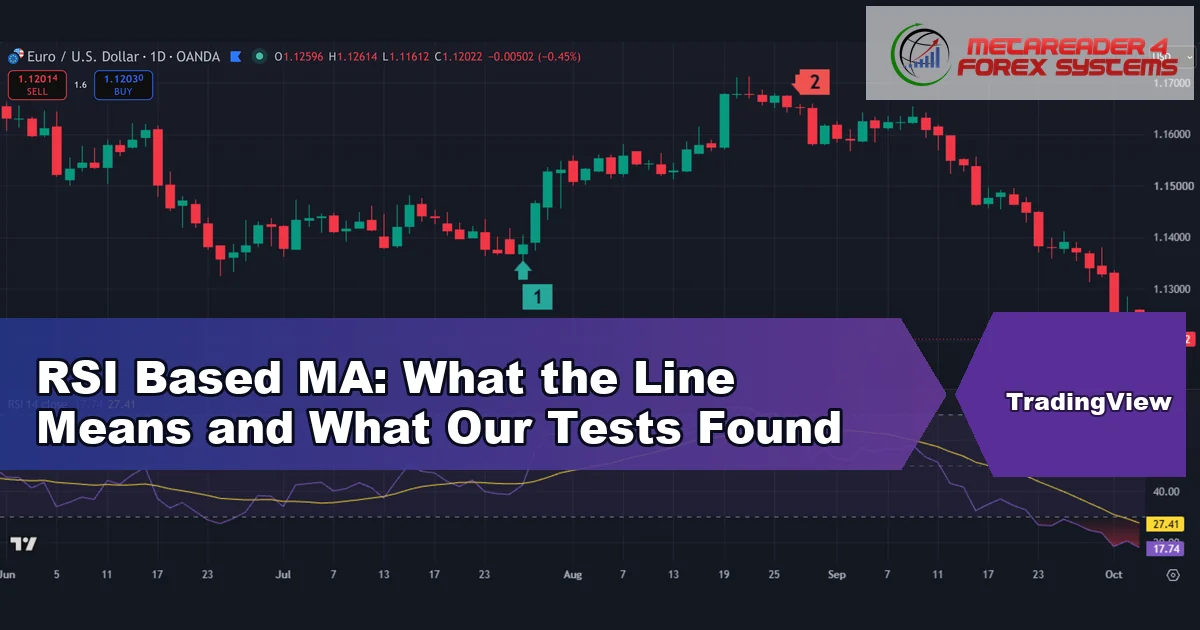
RSI Based MA: What the Line Means and What Our Tests Found

rsi based ma - RSI Based MA: What the Line Means and What Our Tests Found

The RSI based MA is the second line that TradingView draws inside its built-in RSI pane: a 14-bar simple moving average of the RSI itself, shown in yellow on our …

Leave a comment

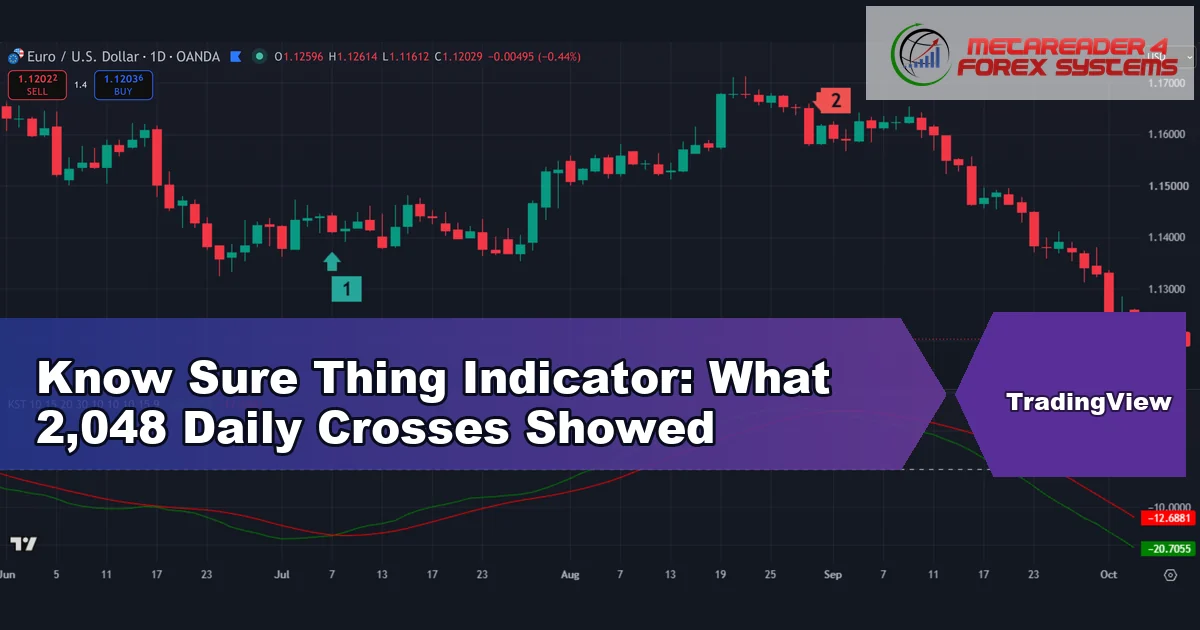
Know Sure Thing Indicator: What 2,048 Daily Crosses Showed

know sure thing indicator - Know Sure Thing Indicator: What 2,048 Daily Crosses Showed

The know sure thing indicator (KST) blends four rate-of-change readings into one slow momentum line, then adds a signal line for crossovers. This guide settles three things. First, how the …

Leave a comment

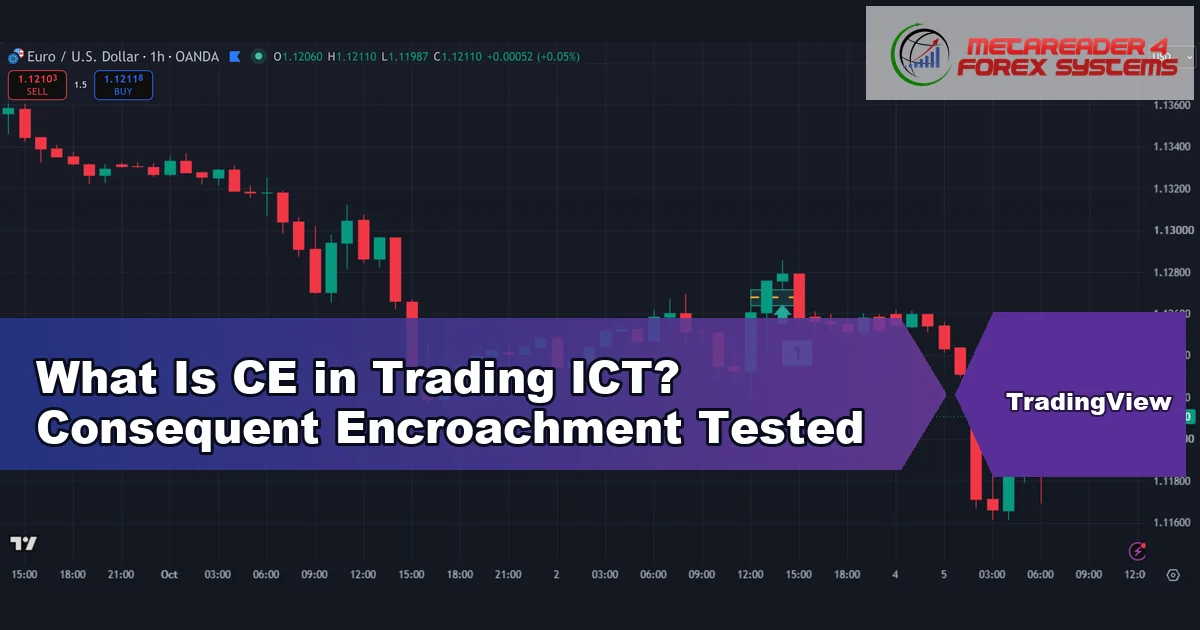
What Is CE in Trading ICT? Consequent Encroachment Tested

what is ce in trading ict - What Is CE in Trading ICT? Consequent Encroachment Tested

What is CE in trading ICT? CE stands for consequent encroachment, and it is simply the 50% midpoint of a fair value gap or of a long wick. This guide …

Leave a comment

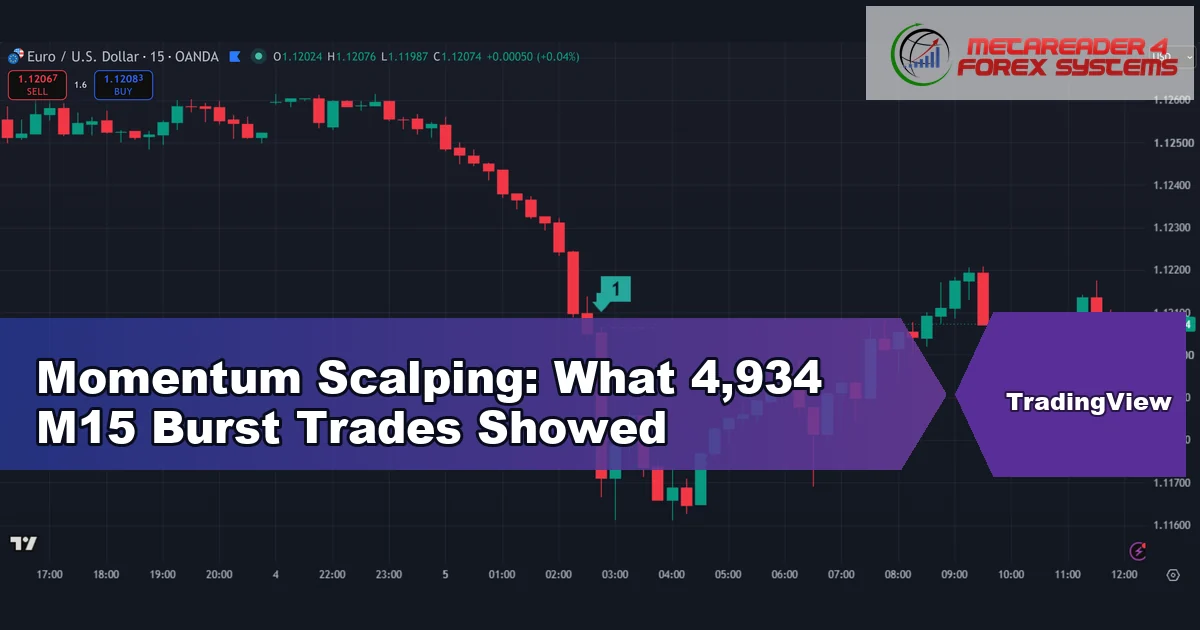
Momentum Scalping: What 4,934 M15 Burst Trades Showed

momentum scalping - Momentum Scalping: What 4,934 M15 Burst Trades Showed

Momentum scalping means jumping on a short, fast burst of price and riding it for a few minutes. We wanted to know if that idea holds up once you write …

Leave a comment

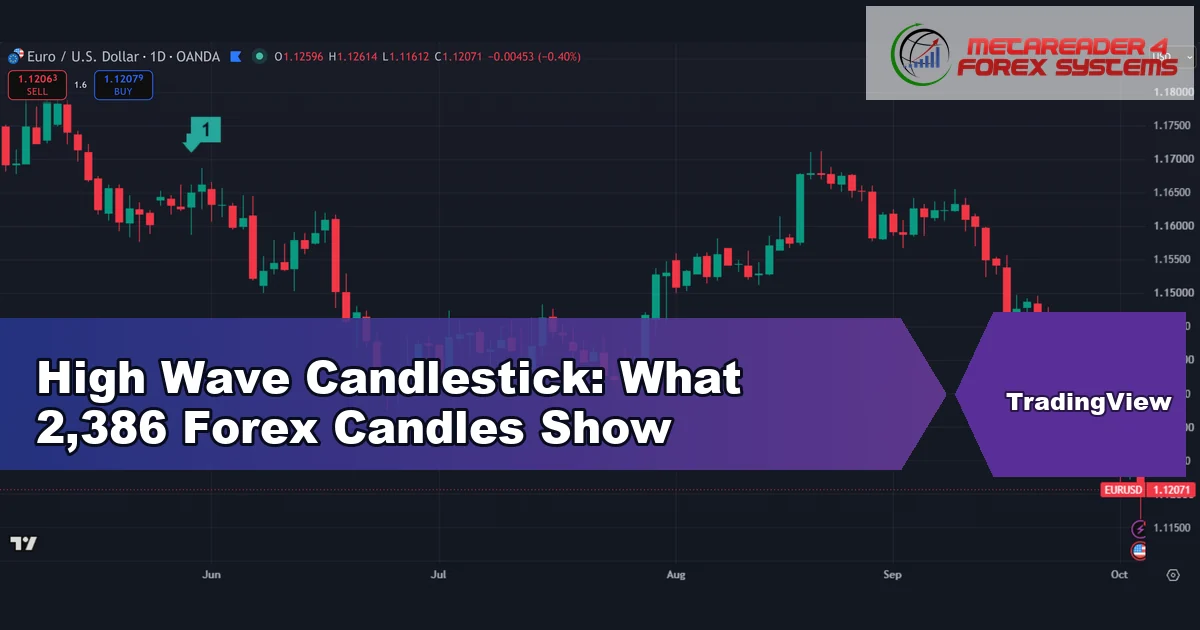
High Wave Candlestick: What 2,386 Forex Candles Show

high wave candlestick - High Wave Candlestick: What 2,386 Forex Candles Show

A high wave candlestick is a candle with a small body and long wicks on both sides, and this guide settles what it really tells a forex trader. We counted …

Leave a comment

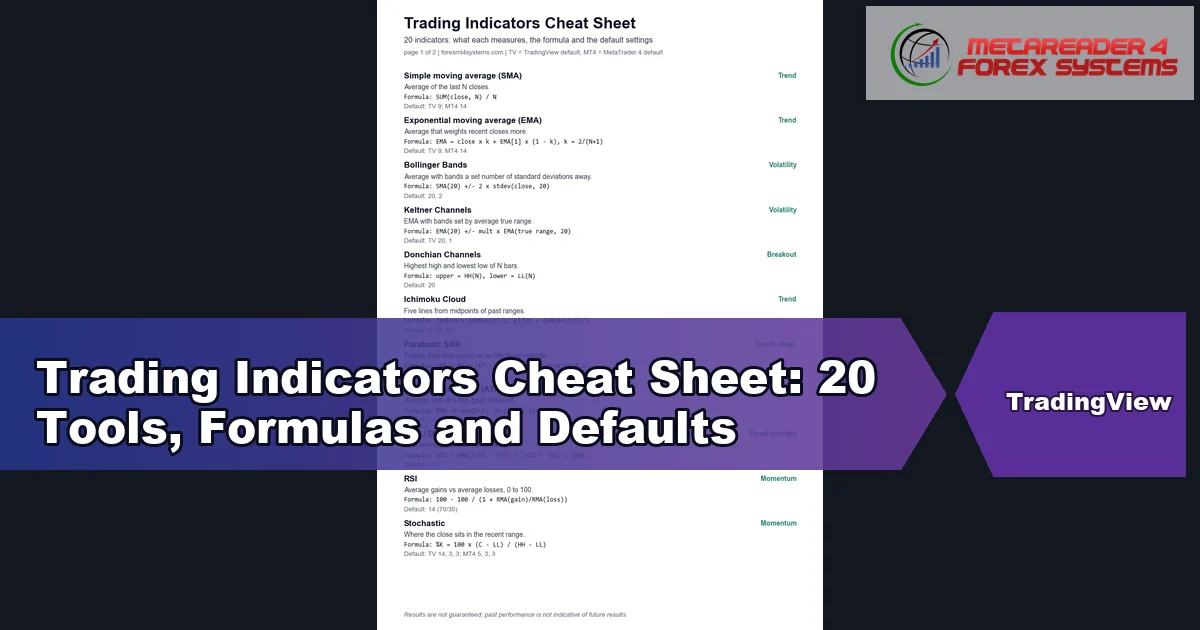
Trading Indicators Cheat Sheet: 20 Tools, Formulas and Defaults

trading indicators cheat sheet - Trading Indicators Cheat Sheet: 20 Tools, Formulas and Defaults

This trading indicators cheat sheet puts 20 common chart tools on two printable pages: what each one measures, its formula, and its default settings on TradingView and MetaTrader 4. Below, …

Leave a comment

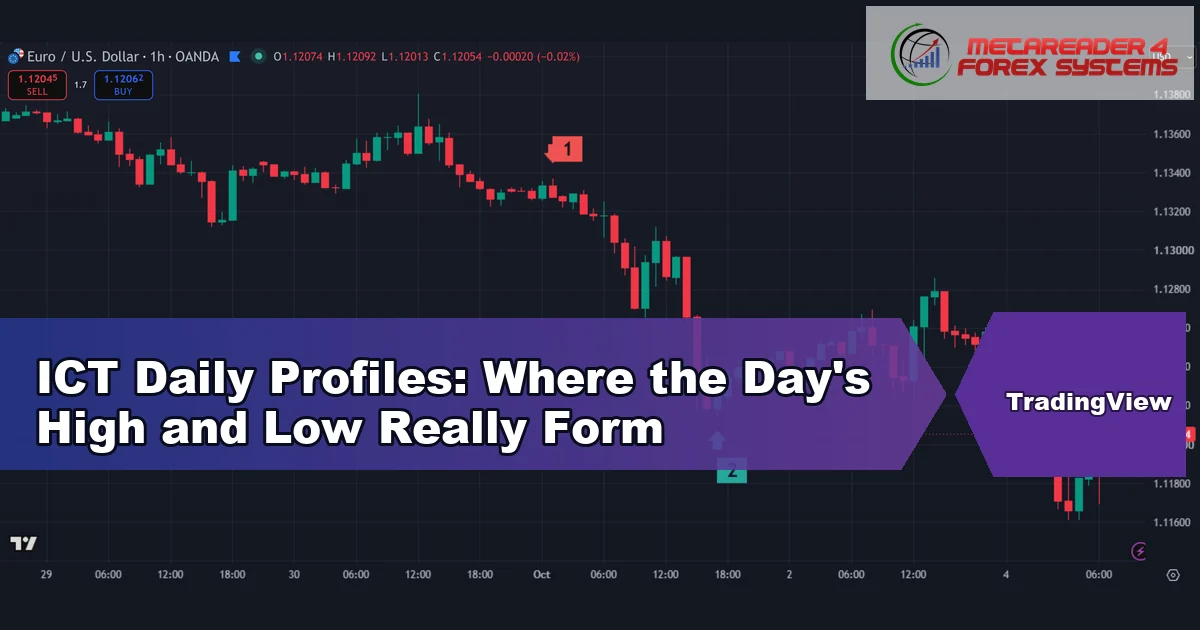
ICT Daily Profiles: Where the Day’s High and Low Really Form

ict daily profiles - ICT Daily Profiles: Where the Day's High and Low Really Form

ICT daily profiles are templates for where a trading day prints its high and its low, and in which session each one forms. This guide settles one plain question: do …

Leave a comment

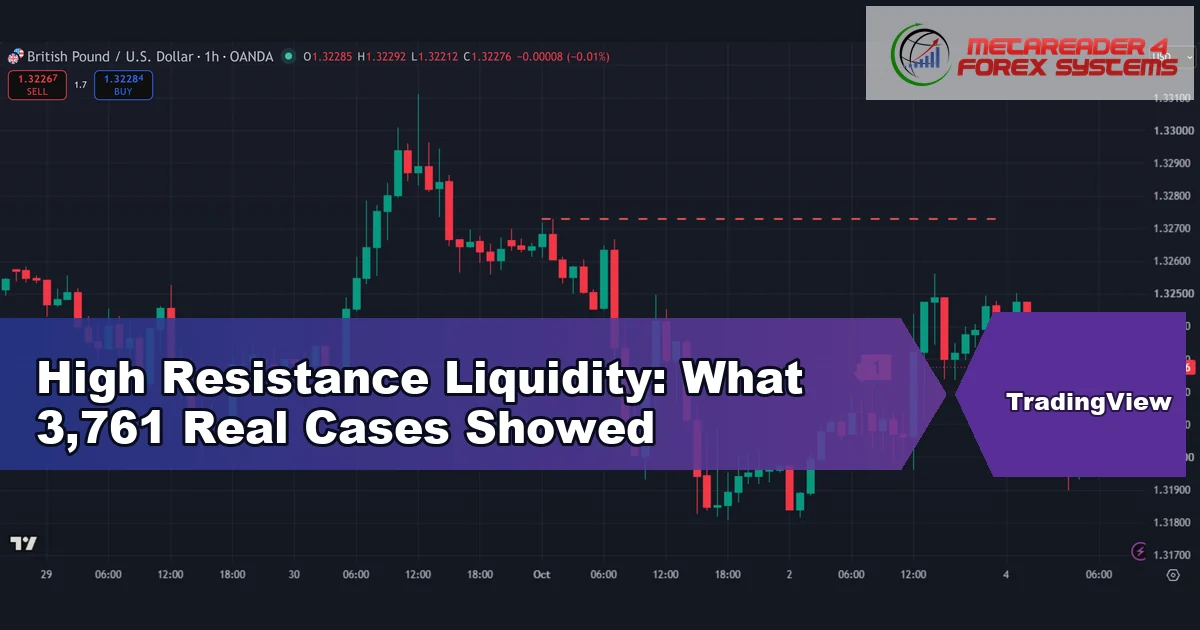
High Resistance Liquidity: What 3,761 Real Cases Showed

high resistance liquidity - High Resistance Liquidity: What 3,761 Real Cases Showed

High resistance liquidity is the ICT name for a price path so crowded with recent trading that a move through it tends to stall. This guide settles three things. First, …

Leave a comment

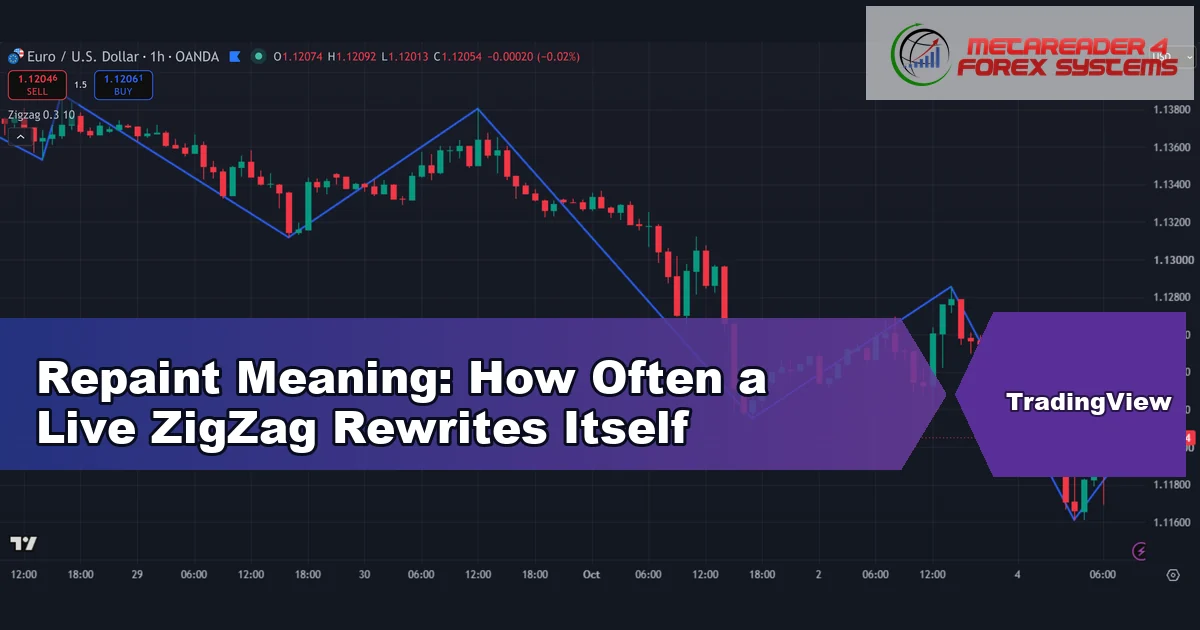
Repaint Meaning: How Often a Live ZigZag Rewrites Itself

repaint meaning - Repaint Meaning: How Often a Live ZigZag Rewrites Itself

The repaint meaning in trading is simple: an indicator repaints when a signal or line it already drew on a closed bar later moves, changes or vanishes. So the chart …

Leave a comment

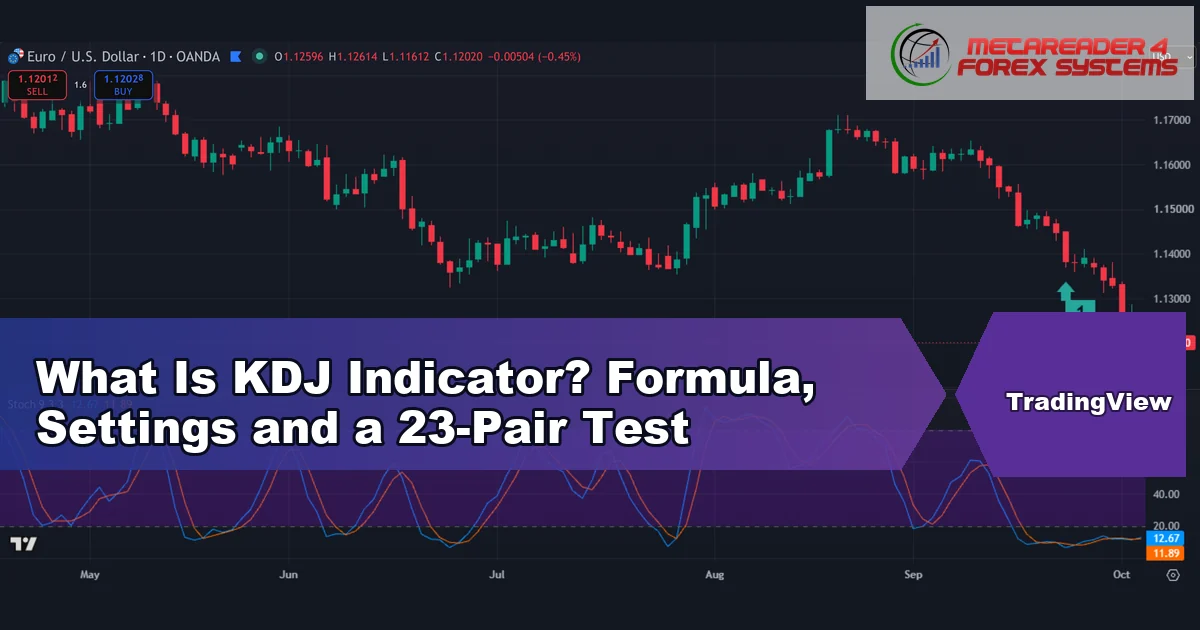
What Is KDJ Indicator? Formula, Settings and a 23-Pair Test

what is kdj indicator - What Is KDJ Indicator? Formula, Settings and a 23-Pair Test

What is KDJ indicator? It is a stochastic oscillator with a third line, J, that stretches the gap between the two classic lines and can run past 0 and 100. …

Leave a comment

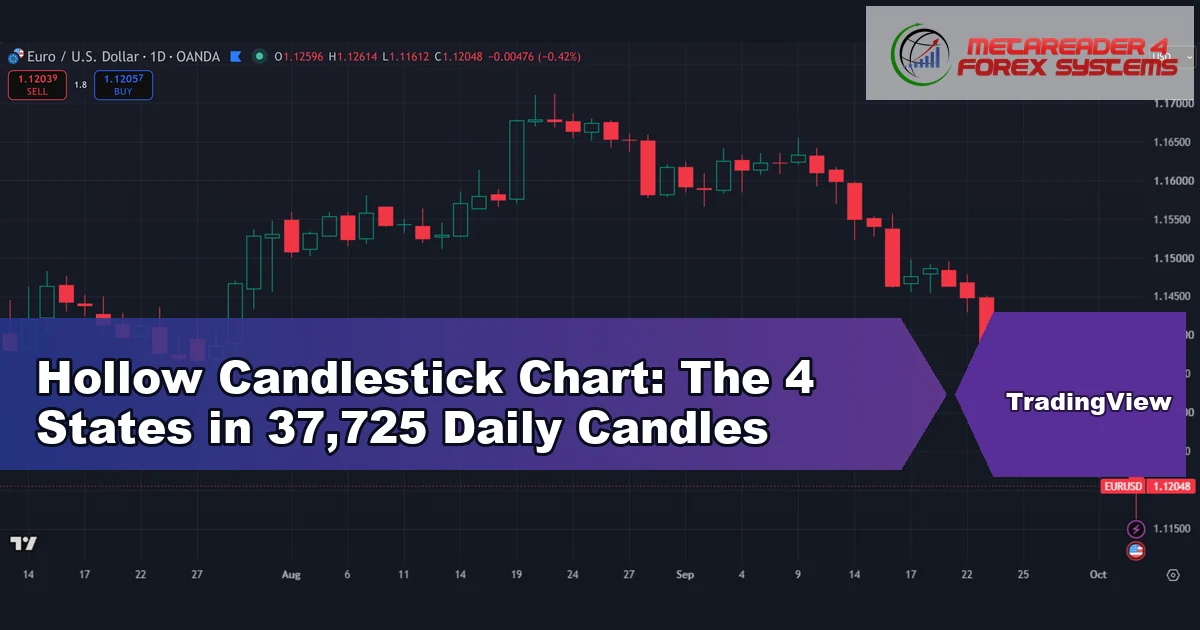
Hollow Candlestick Chart: The 4 States in 37,725 Daily Candles

hollow candlestick chart - Hollow Candlestick Chart: The 4 States in 37,725 Daily Candles

A hollow candlestick chart draws each candle with two answers instead of one: the fill tells you how price moved inside the bar, and the colour tells you how the …

Leave a comment

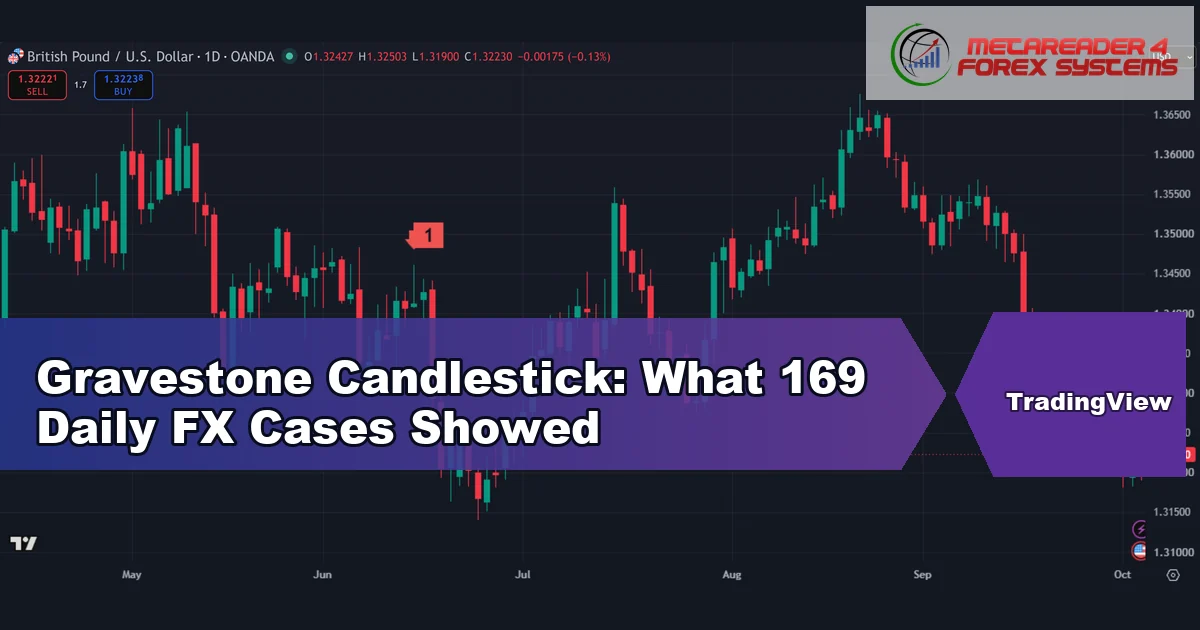
Gravestone Candlestick: What 169 Daily FX Cases Showed

gravestone candlestick - Gravestone Candlestick: What 169 Daily FX Cases Showed

A gravestone candlestick is a doji whose open and close sit at the low of the bar, with a long upper wick above them. Textbooks call it a bearish reversal …

Leave a comment

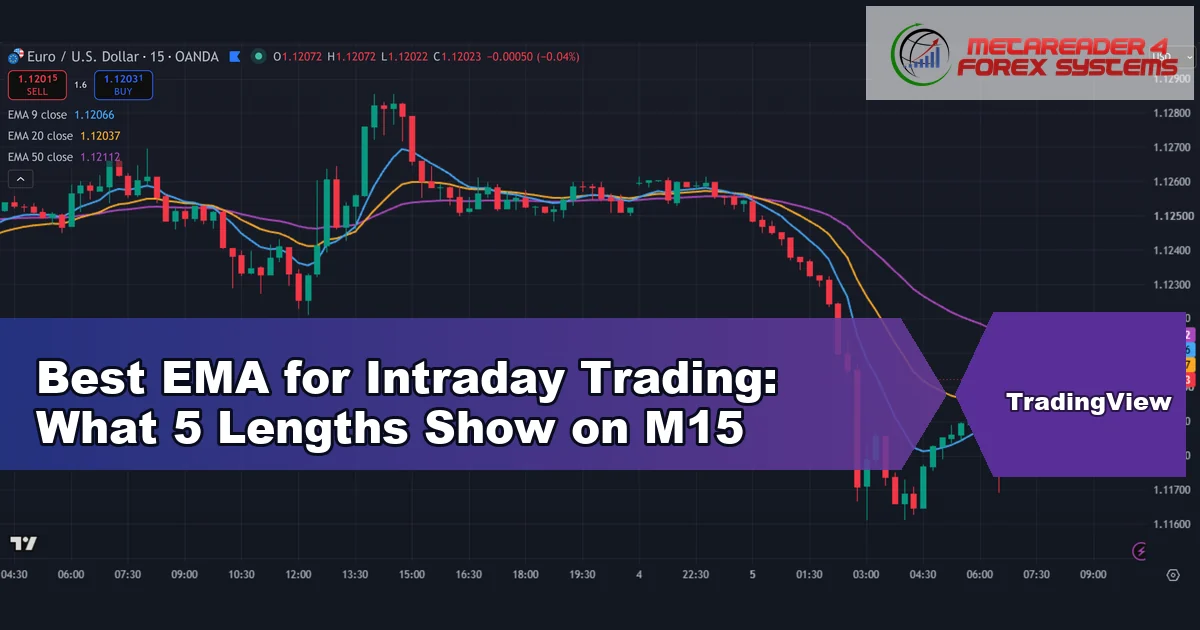
Best EMA for Intraday Trading: What 5 Lengths Show on M15

best ema for intraday trading - Best EMA for Intraday Trading: What 5 Lengths Show on M15

The best EMA for intraday trading is the question this guide answers with data rather than opinion. We measured five common lengths (9, 20, 50, 100 and 200) on 15-minute …

Leave a comment

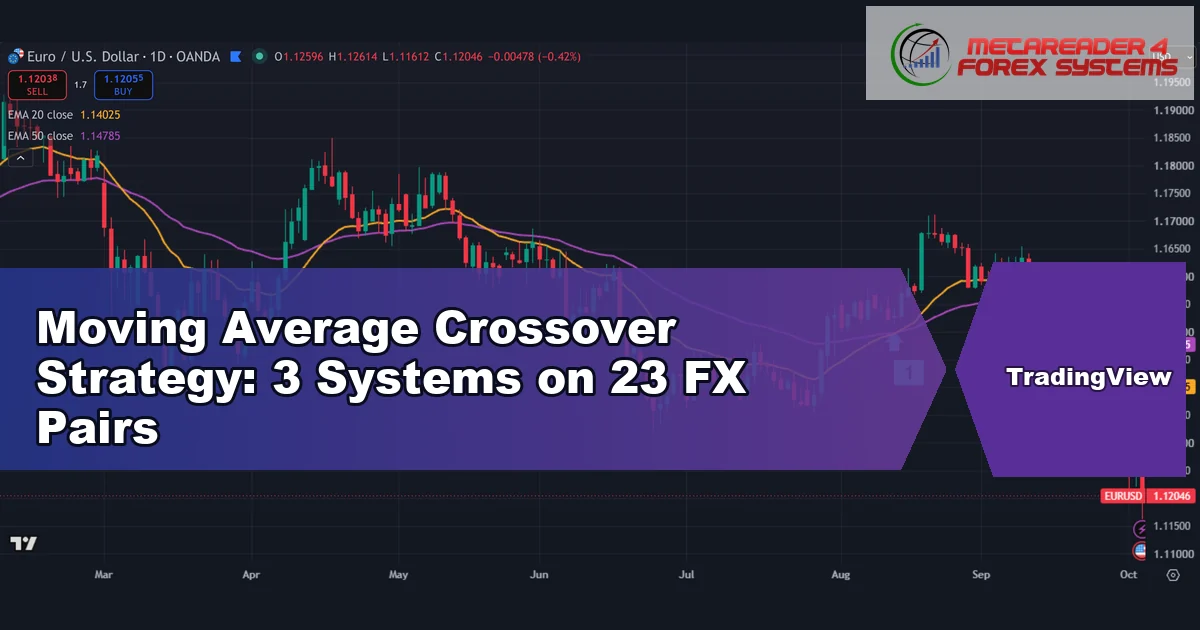
Moving Average Crossover Strategy: 3 Systems on 23 FX Pairs

moving average crossover strategy - Moving Average Crossover Strategy: 3 Systems on 23 FX Pairs

A moving average crossover strategy buys when a fast average crosses above a slow one and sells when it crosses back below. We ran three popular pairs of averages on …

Leave a comment

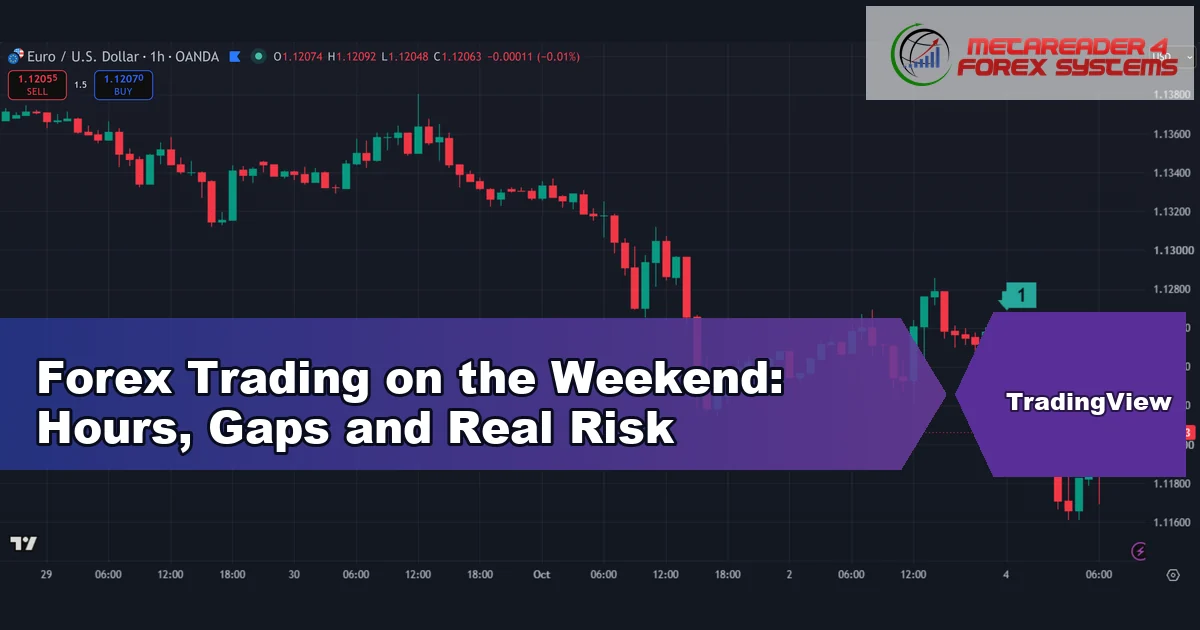
Forex Trading on the Weekend: Hours, Gaps and Real Risk

forex trading on the weekend - Forex Trading on the Weekend: Hours, Gaps and Real Risk

Forex trading on the weekend is not possible in the spot market, because the interbank market shuts at the Friday close and only reopens on Sunday evening, UTC. So the …

Leave a comment

ICT Terms: A Plain-English Glossary With Measured Facts

ict terms - ICT Terms: A Plain-English Glossary With Measured Facts

ICT terms are the shorthand that Inner Circle Trader and Smart Money Concepts traders use to name liquidity, gaps, structure, zones and time windows on a chart. This glossary settles …

Leave a comment

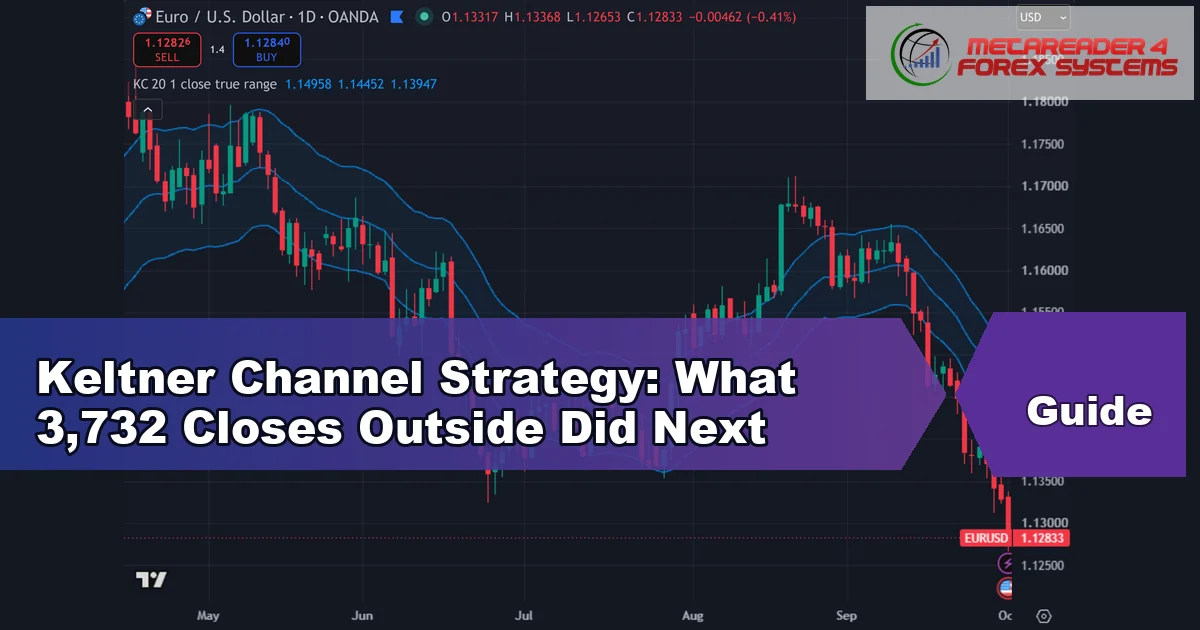
Keltner Channel Strategy: What 3,732 Closes Outside Did Next

keltner channel strategy - Keltner Channel Strategy: What 3,732 Closes Outside Did Next

A Keltner channel strategy trades closes outside a volatility band drawn around a 20-period EMA. Some traders buy a close above the upper band as a breakout. Others fade it …

Leave a comment

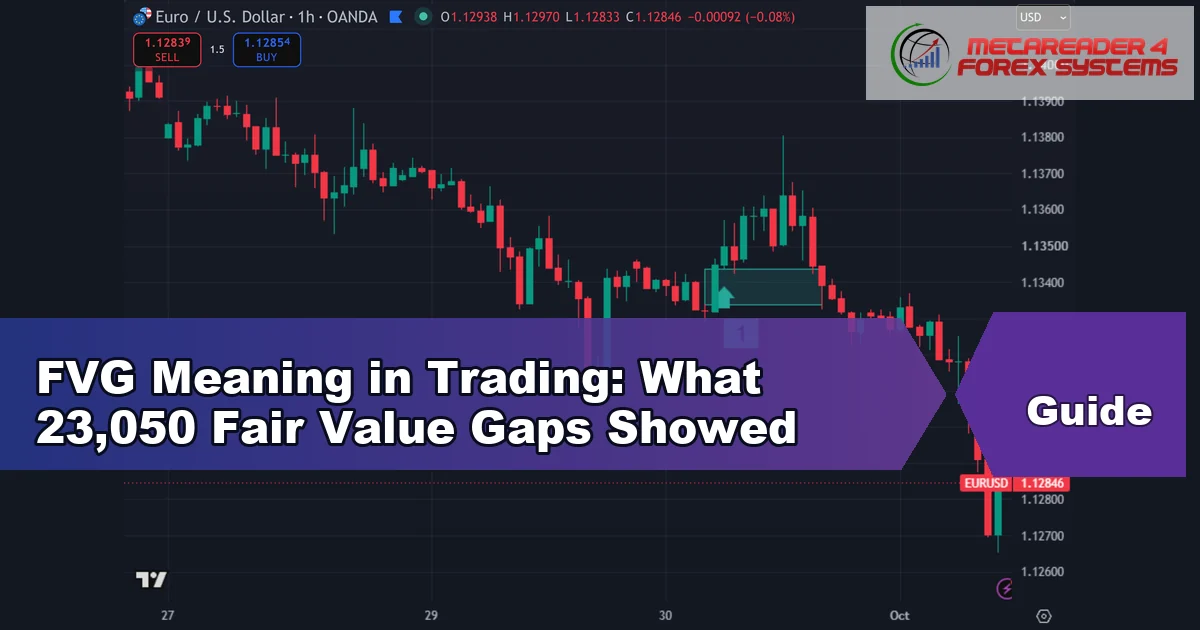
FVG Meaning in Trading: What 23,050 Fair Value Gaps Showed

fvg meaning in trading - FVG Meaning in Trading: What 23,050 Fair Value Gaps Showed

The FVG meaning in trading is simple: a fair value gap is a three-candle imbalance, a slice of price that one fast candle skipped. This guide settles three things. First, …

Leave a comment

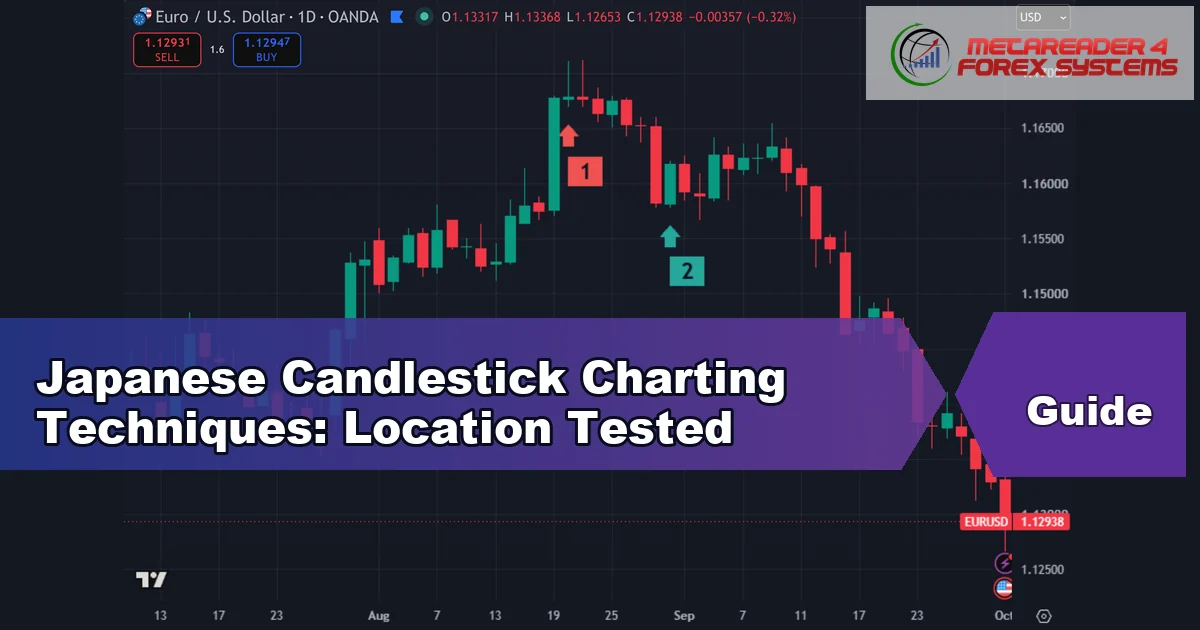
Japanese Candlestick Charting Techniques: Location Tested

japanese candlestick charting techniques - Japanese Candlestick Charting Techniques: Location Tested

Japanese candlestick charting techniques are more than a list of shapes to memorise, and this guide is about the part most lists skip. A hammer or a tweezer top means …

Leave a comment

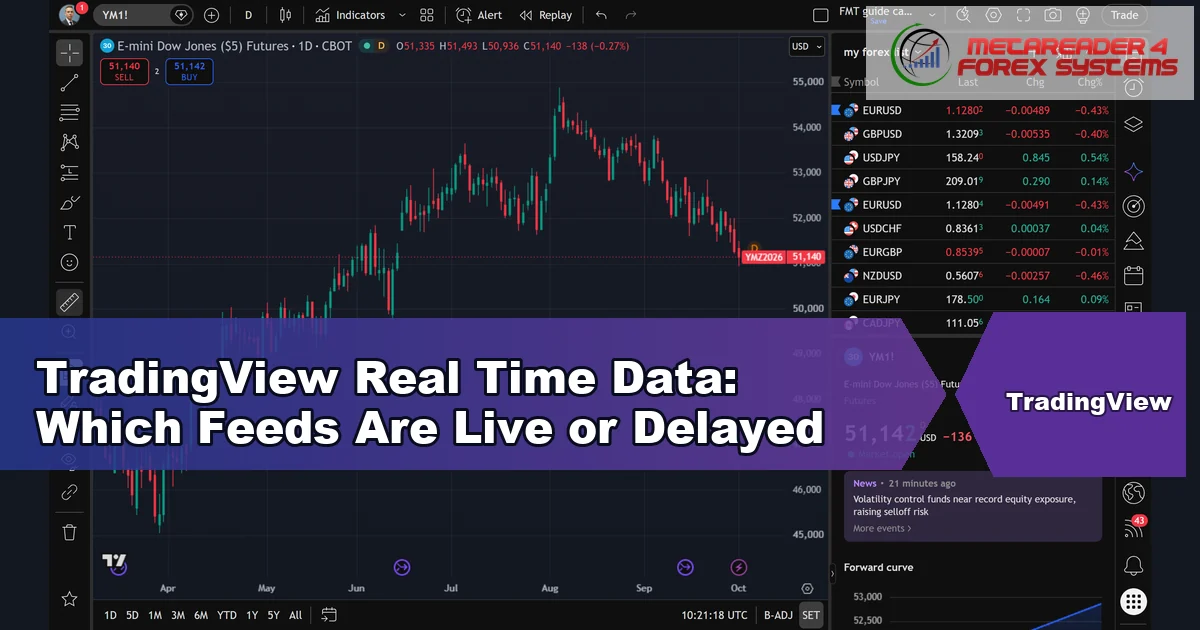
TradingView Real Time Data: Which Feeds Are Live or Delayed

tradingview real time data - TradingView Real Time Data: Which Feeds Are Live or Delayed

TradingView real time data is free for some markets and late for others, and the chart tells you which one you have if you know where to look. This guide …

Leave a comment

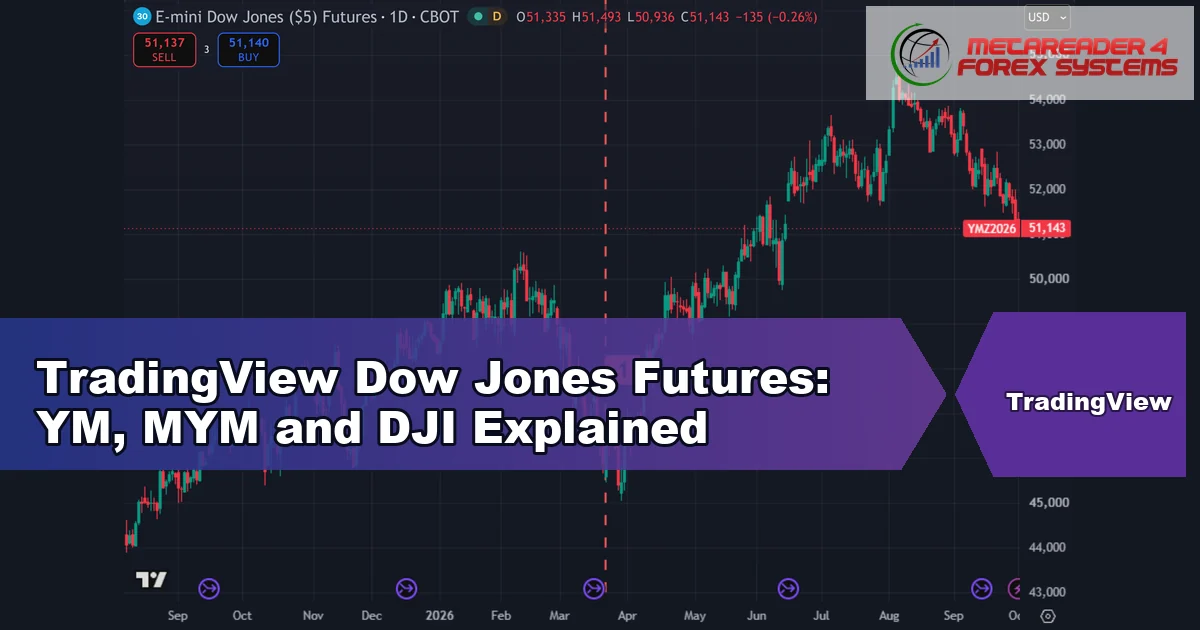
TradingView Dow Jones Futures: YM, MYM and DJI Explained

tradingview dow jones futures - TradingView Dow Jones Futures: YM, MYM and DJI Explained

TradingView Dow Jones futures sit under a handful of symbols, and the right one depends on what you want to see. This guide settles which symbol to load, what one …

Leave a comment

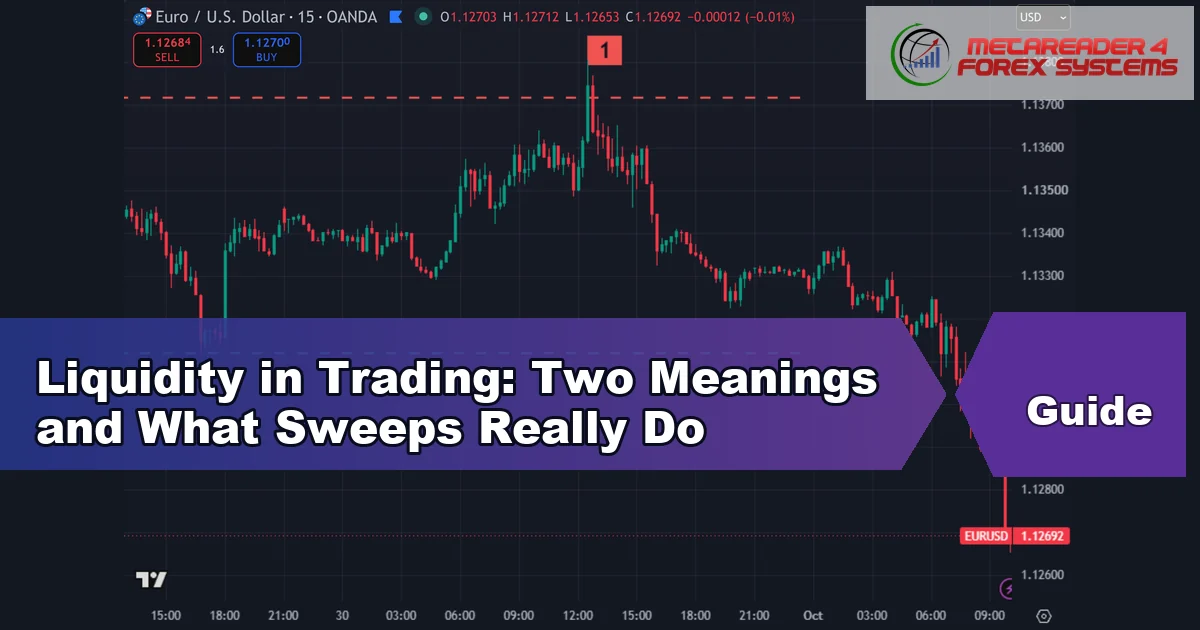
Liquidity in Trading: Two Meanings and What Sweeps Really Do

liquidity in trading - Liquidity in Trading: Two Meanings and What Sweeps Really Do

Liquidity in trading has two meanings, and most confusion comes from mixing them up. The first is market liquidity: how easily you can trade size without moving the price. The …

Leave a comment

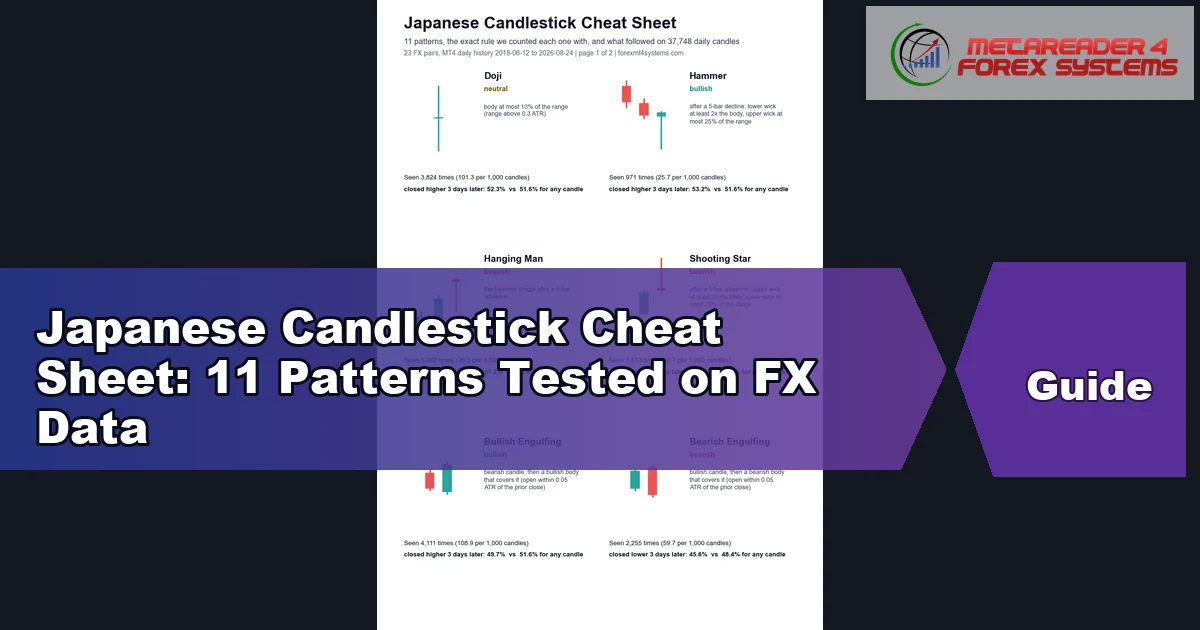
Japanese Candlestick Cheat Sheet: 11 Patterns Tested on FX Data

japanese candlestick cheat sheet - Japanese Candlestick Cheat Sheet: 11 Patterns Tested on FX Data

This Japanese candlestick cheat sheet covers 11 common patterns, each with the exact rule we used to count it and what price did 1, 3 and 5 days later. We …

Leave a comment

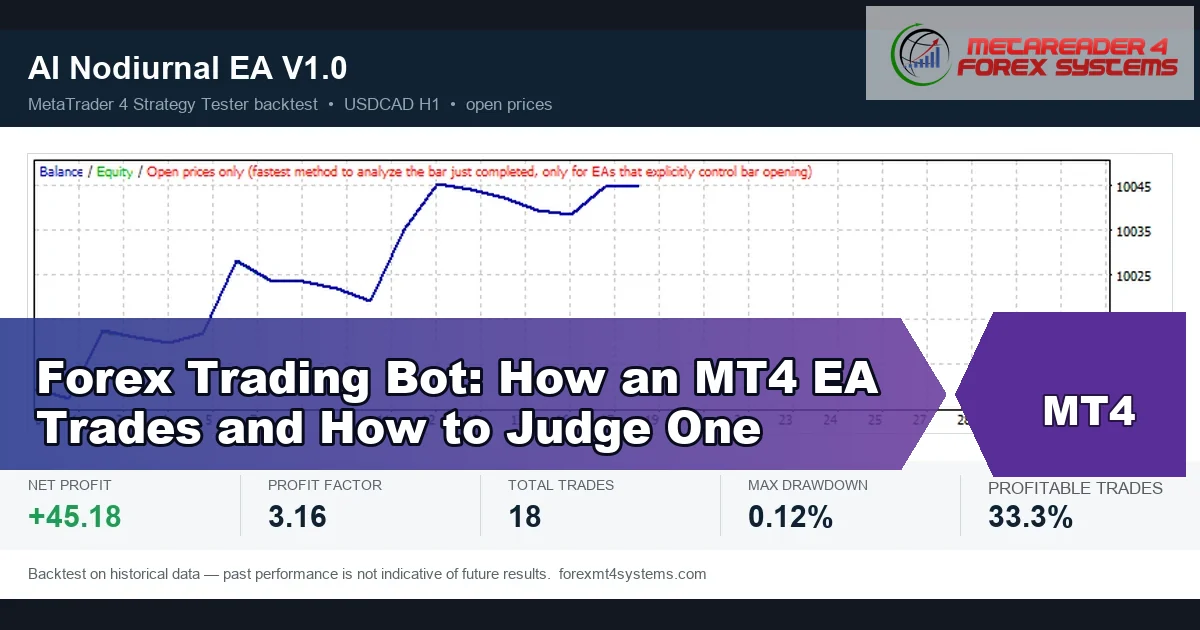
Forex Trading Bot: How an MT4 EA Trades and How to Judge One

forex trading bot - Forex Trading Bot: How an MT4 EA Trades and How to Judge One

A forex trading bot is a program that reads the chart and places trades on your account without you clicking a button. On MetaTrader 4 and MetaTrader 5 it is …

Leave a comment

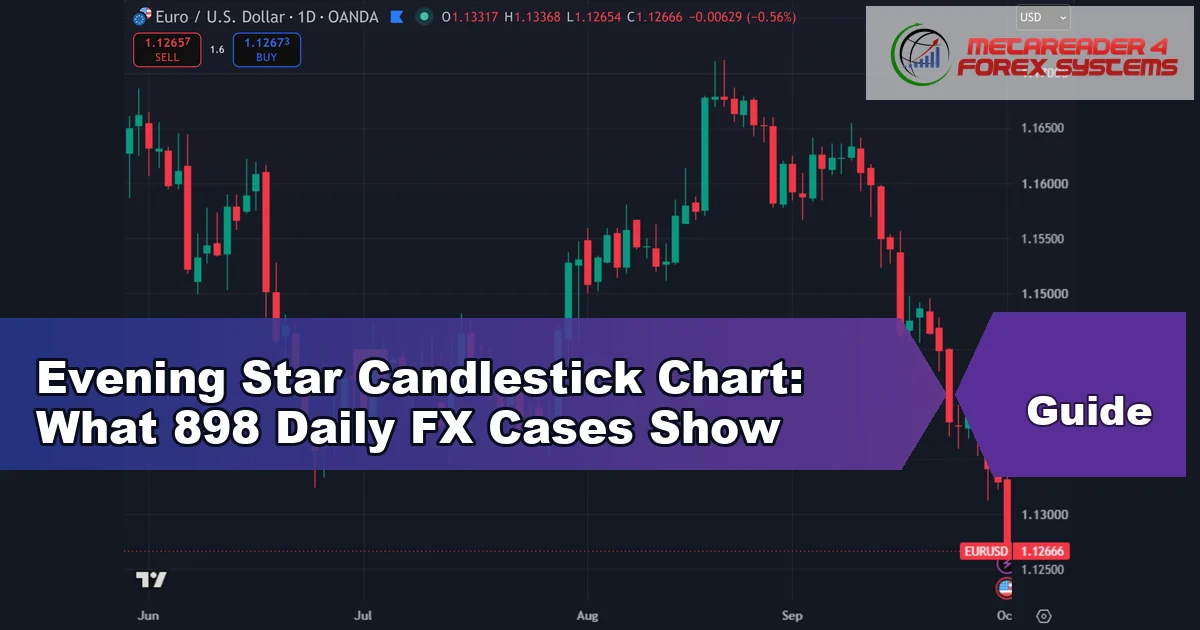
Evening Star Candlestick Chart: What 898 Daily FX Cases Show

evening star candlestick chart - Evening Star Candlestick Chart: What 898 Daily FX Cases Show

An evening star candlestick chart pattern is three candles that are said to mark the end of a rally: a strong up candle, a small pause candle, then a strong …

Leave a comment
Older posts
Newer posts
← Previous Page1 Page2 Page3 Page4 Page5 Next →
TradingView charts and trading platform
Instant Funding Master funded trading account offer
Cashback Forex broker rebates

Risk Disclosure: Trading futures and foreign exchange carries a high degree of risk and is not appropriate for everyone. You may lose part, all, or more than the funds you commit. Trade only with risk capital — money you can afford to part with without harming your financial stability or way of life. If you do not hold surplus capital of this kind, you should not trade these markets. Past performance is not necessarily indicative of future results.

Hypothetical Performance Disclosure: Simulated or hypothetical results carry built-in limitations, several of which are noted here. No claim is made that any account has achieved or is likely to achieve gains or losses comparable to those shown; in practice, live outcomes often diverge sharply from modelled ones. A key shortcoming of hypothetical figures is that they are usually constructed after the fact, with full knowledge of how the market moved. Back-tested trading also puts no real money on the line, so no simulated record can fully reflect how financial risk shapes live decisions. A trader's capacity to absorb drawdowns, or to keep following a system through a losing streak, materially affects real returns and cannot be reproduced in a model. Many further market and execution variables likewise escape any hypothetical calculation, and each can work against actual trading performance.

Testimonials Disclosure: Comments or reviews shown on this site reflect individual experiences and may not match the results of other visitors or customers. They are not a promise of future performance or success.

General Disclosure & Limitation of Liability: FOREXMT4SYSTEMS.COM publishes all material for educational and informational purposes only and accepts no liability for trading losses or for any decisions taken on the basis of this content. We may receive compensation through advertising, affiliate partnerships, or product sales; this never compromises our editorial independence or transparency. Trading carries risk, and past performance does not assure future results.

About · Author: Dominic Walsh · Contact · Editorial & Testing Policy · Disclaimer · Privacy · All Indicators A-Z · Install Guide

Copyright © 2026 FOREXMT4SYSTEMS.COM